CHAPTER 11 FIGURES
To see full-size figures, just click the thumbnails. To download
high-resolution PDF versions for printing, please click here.
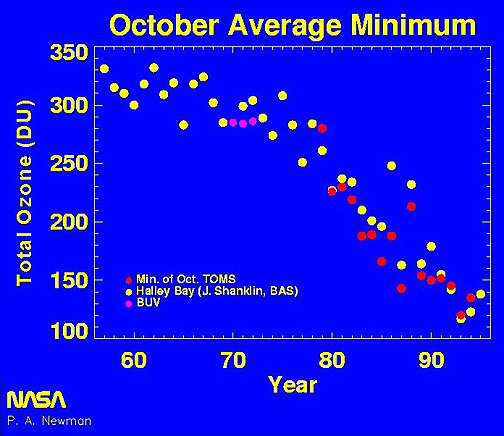
- Figure 11.01
- October Ozone Minimum at Halley Bay, Antarctica
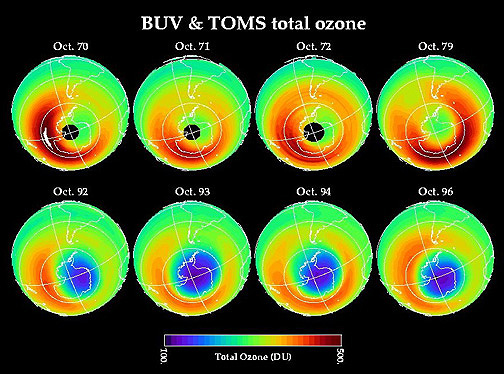
- Figure 11.02
- BUV and TOMS Antarctic Ozone Data
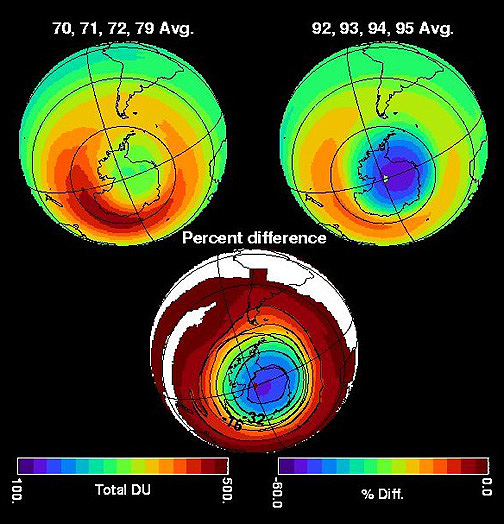
- Figure 11.03
- Antarctic Ozone Percent Differences Between the 1970s and
1990s
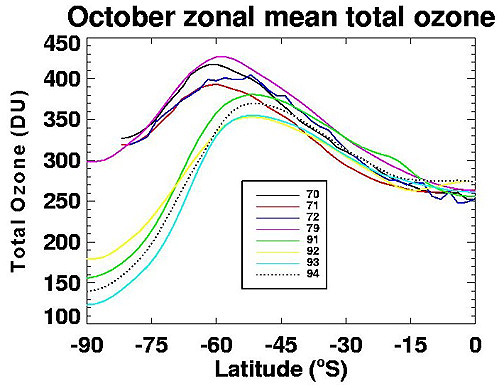
- Figure 11.04
- October Zonal Mean Total Ozone
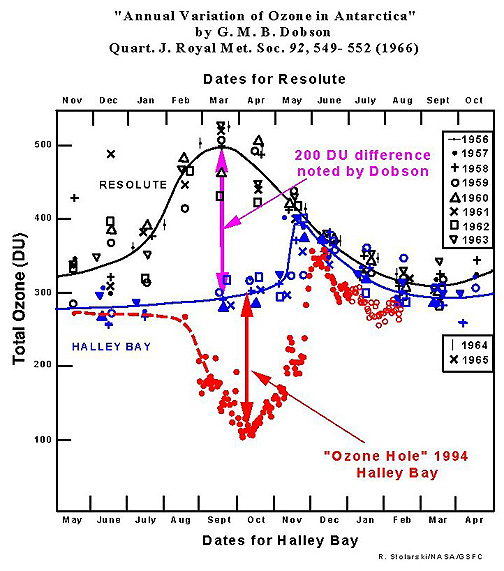
- Figure 11.05
- Annual Variations of Ozone in Antarctica
- Figure 11.06
- Antarctic Ozone Hole at Syowa, Antarctica for 1982
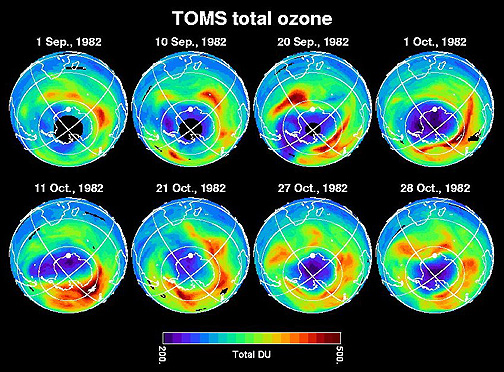
- Figure 11.07
- TOMS Total Ozone for Sept-Oct 1982
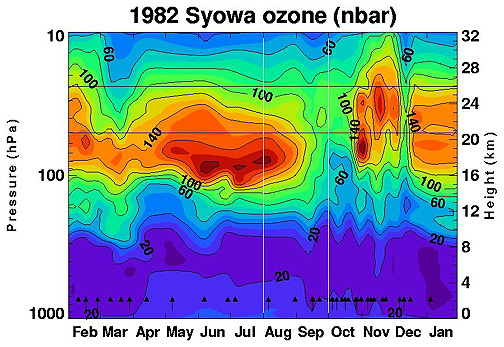
- Figure 11.08
- Syowa Ozone Profiles for 1982
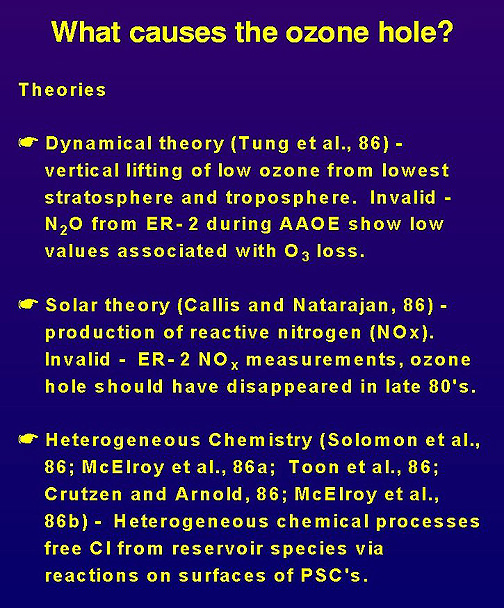
- Figure 11.09
- What Causes the Ozone Hole?
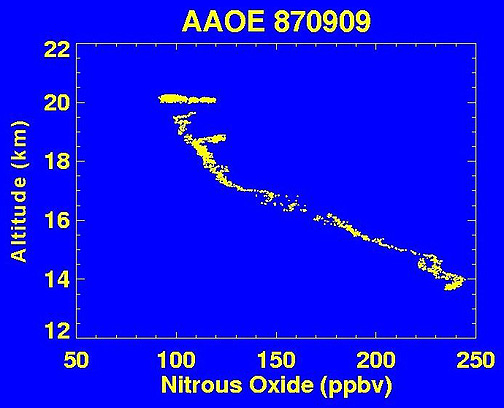
- Figure 11.10
- Nitrous Oxide Measurements From AAOE Mission
- Figure 11.11
- Column Abundances of NOx for Sept. 21, 1987, as Measured by
AAOE Campaign
- Figure 11.12
- NCEP Temperature and Wind Analysis Showing Antarctic Polar
Vortex
- Figure 11.13
- Southern Hemisphere Balanced Zonal Wind for August
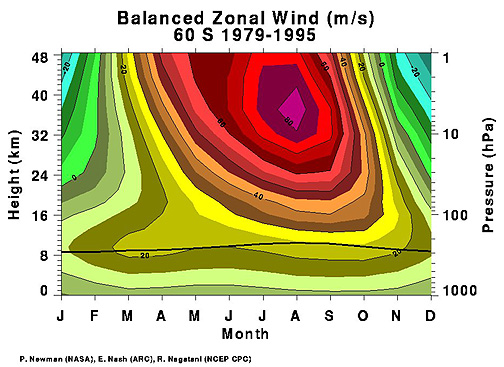
- Figure 11.14
- Balanced Zonal Wind at 60°S
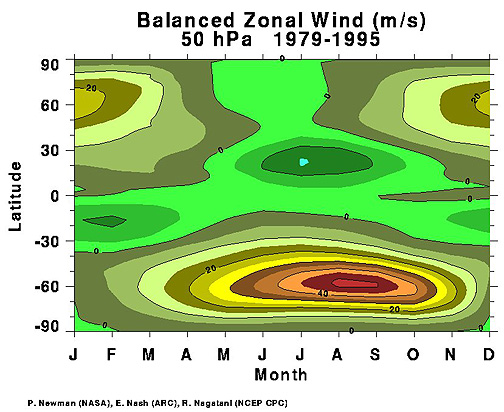
- Figure 11.15
- Balanced Zonal Wind at 50hPa
- Figure 11.16
- Zonal Mean of Temperature for August (1979-1995)
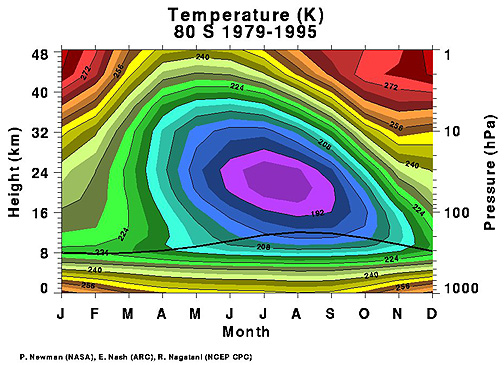
- Figure 11.17
- Seasonal Variations in Temperature With Altitude at
80°S
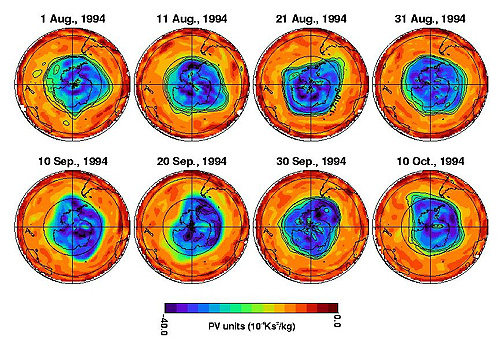
- Figure 11.18
- Potential Vorticity in the Southern Hemisphere Winter
1994
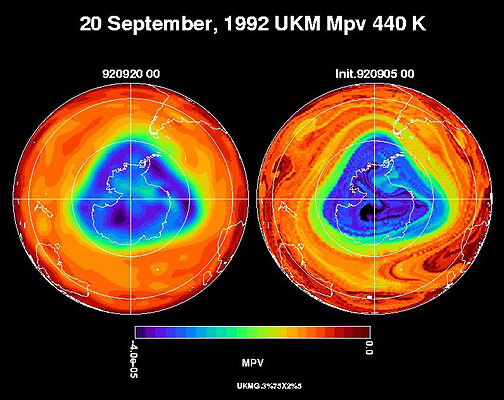
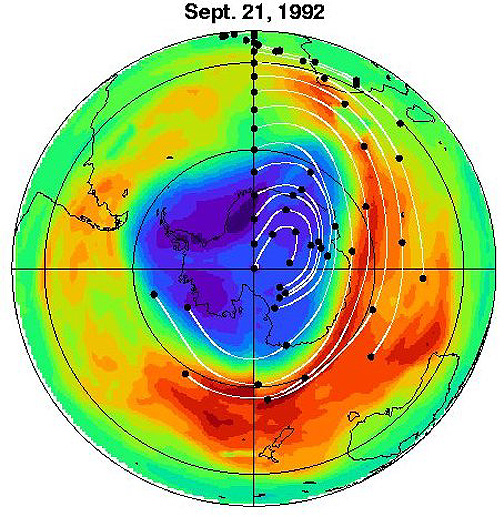
- Figure 11.19
- Potential Vorticity Plot for September 20, 1992
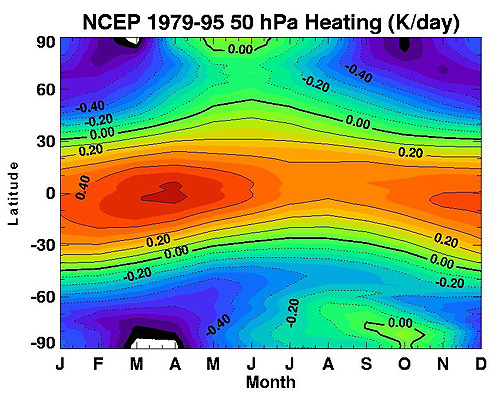
- Figure 11.20
- Global Net Heating Rate at 50hPa (1979-1995 NCEP Data)
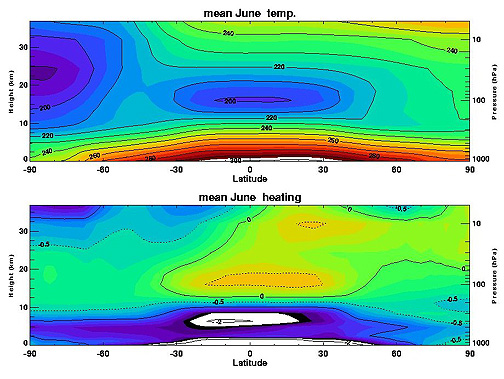
- Figure 11.21
- June Zonal Mean Temperature and Heating Rate (1979-1995
Average)

- Figure 11.22
- Air Parcel Trajectories Inside the Polar Vortex, Sept. 20-14,
1992, With Total Ozone
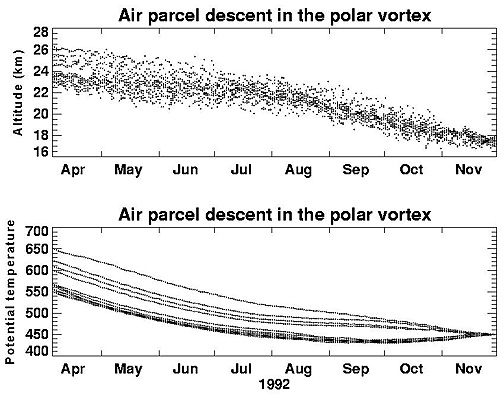
- Figure 11.23
- Air Parcel Descent Inside the Polar Vortex, Apr.-Nov.
1992
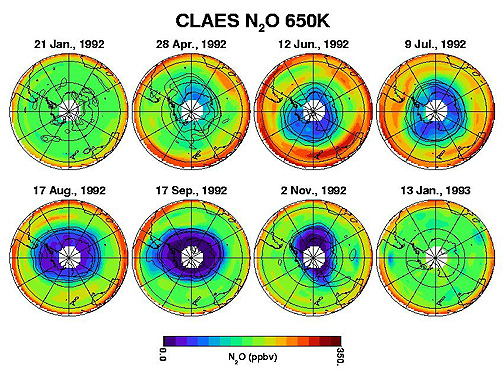
- Figure 11.24
- CLAES Measured N2O Concentrations on
the 650K Surface for Selected Days in 1992 and 1993 as Tracer of
Stratospheric Motions and Evolution of Polar Vortex
- Figure 11.25
- Southern Hemisphere Wintertime Stratospheric (Brewer-Dobson)
Circulation
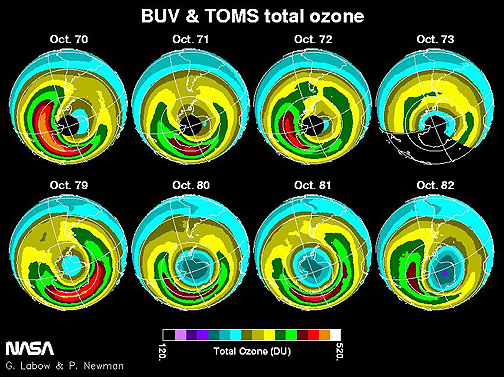
- Figure 11.26a
- TOMS Total Ozone for October 1970-1982
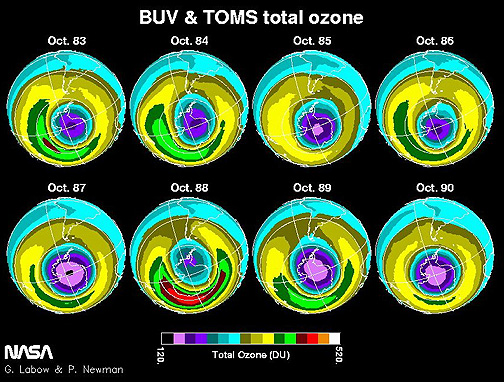
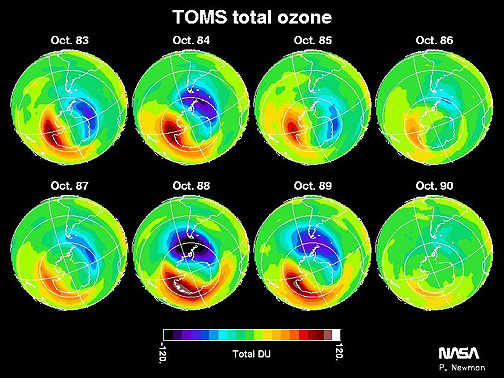
- Figure 11.26b
- TOMS Total Ozone for October 1983-1990
- Figure 11.27
- October Zonal Mean Ozone (1979-1992 TOMS Data)

- Figure 11.28
- Wave One Pattern in the Zonal Mean Total Ozone Field
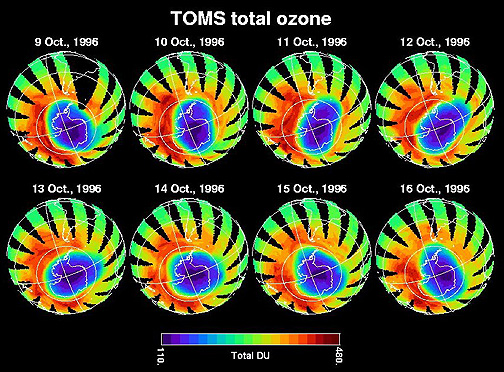
- Figure 11.29
- EP-TOMS Total Ozone for Selected Days in October 1996
- Figure 11.30
- SBUV Measured Ozone Profiles (Mixing Ratio and Density) for
October 1987
- Figure 11.31
- Ozone Profiles Measured at the South Pole, Sept.-Oct.
1994
- Figure 11.32
- The Annual Cycle of Total Ozone for All Latitudes Based on
TOMS 1979-1992 Data
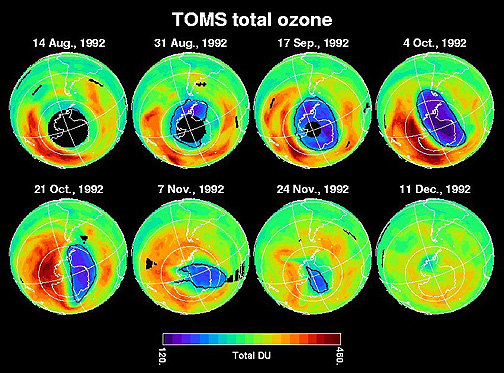
- Figure 11.33
- TOMS Southern Hemisphere Total Ozone Images for
August-December 1992
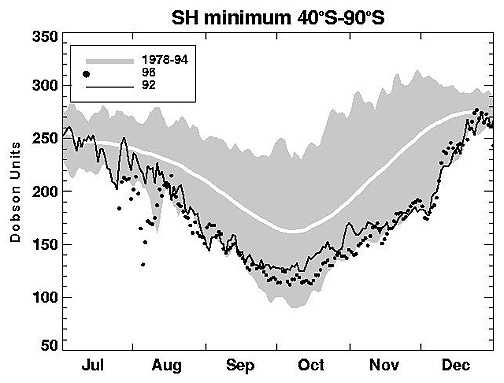
- Figure 11.34
- TOMS-Derived Daily Minimum Ozone Amounts for the Southern
Hemisphere for 1992 vs 1996 with 1979-1994 Data as Background
Average
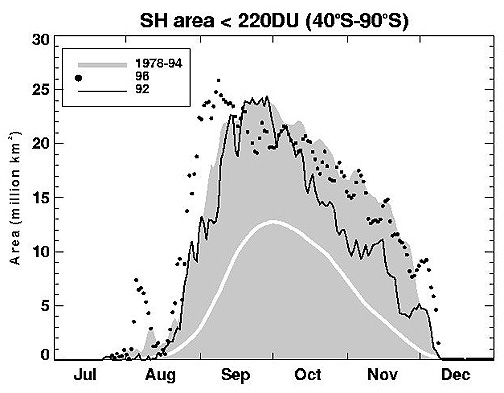
- Figure 11.35
- TOMS-Derived Ozone Hole Areal Size for 1992 vs 1996 With
1979-1994 Data as Background Average (Ozone hole is defined as
total ozone <220 DU)
- Figure 11.36
- Average Ozone Hole Size for September 7-October 13 (1979-1996
average)
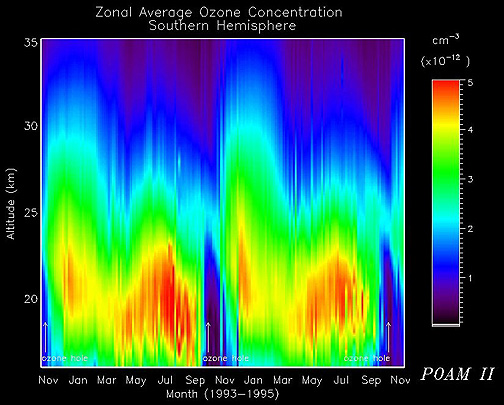
- Figure 11.37
- Zonal Average Ozone Concentration for the Southern Hemisphere
(POAM II Data)

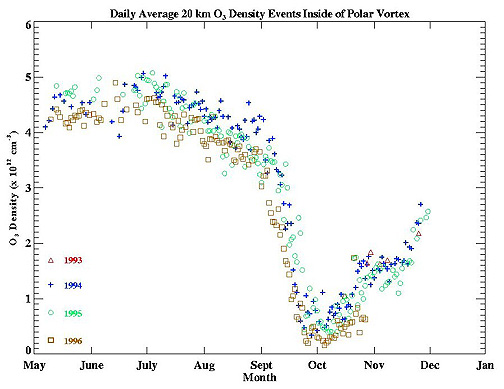
- Figure 11.38
- Daily Average Ozone Density at 20 Kilometers Inside the Polar
Vortex
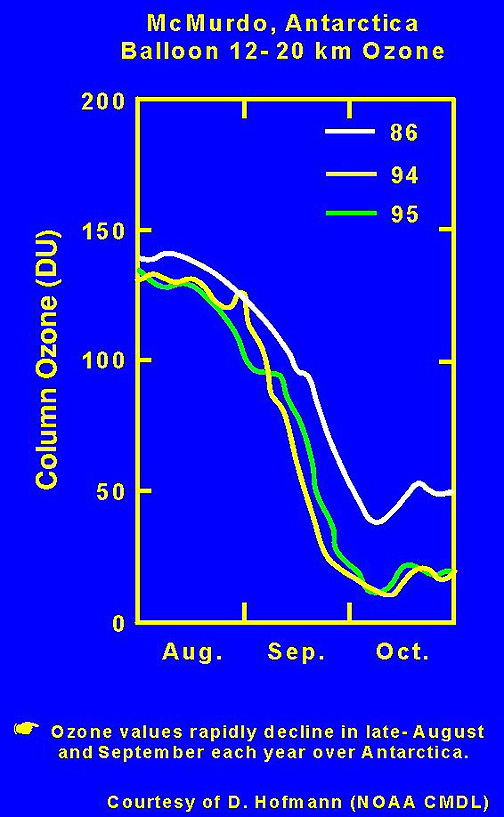
- Figure 11.39
- McMurdo Base, Antarctica Balloon Observations of Ozone at 12
to 20 Kilometers
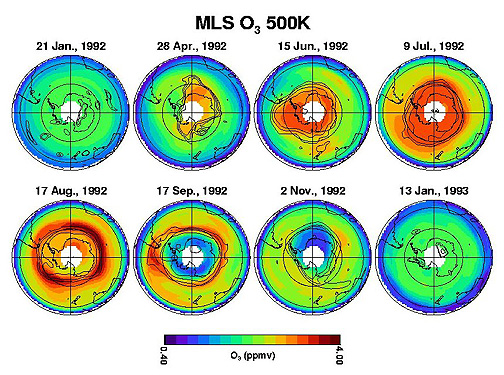
- Figure 11.40
- MLS Measured Ozone on the 500 Kelvin Isentropic Surface
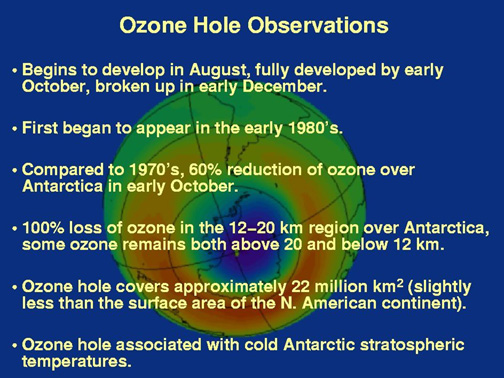
- Figure 11.41
- Ozone Hole Observations Summary
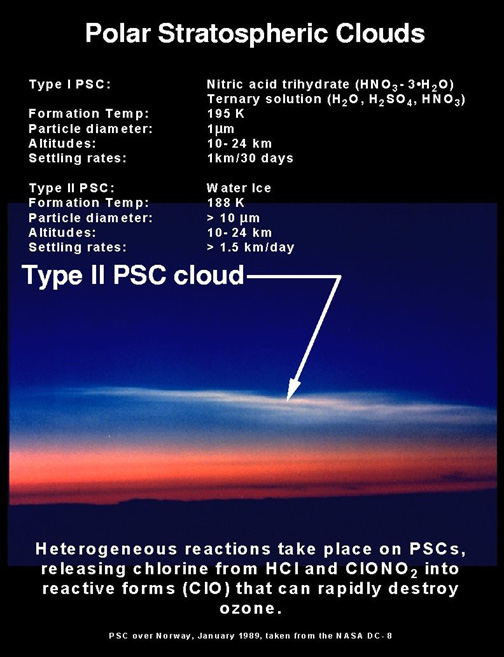
- Figure 11.42
- Polar Stratospheric Clouds
- Figure 11.43
- Antarctic Polar Stratospheric Cloud Frequency Distribution
(from POAM II data)
- Figure 11.44
- Plot of Aerosol Particle Volume as a Function of Temperature
(based on MASP data)
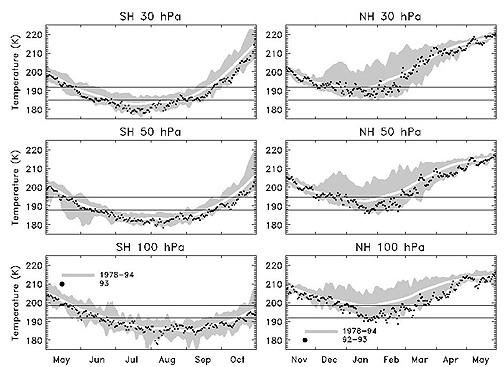
- Figure 11.45
- Winter Temperature Range Inside Northern and Southern Polar
Vortex at Three Altitudes
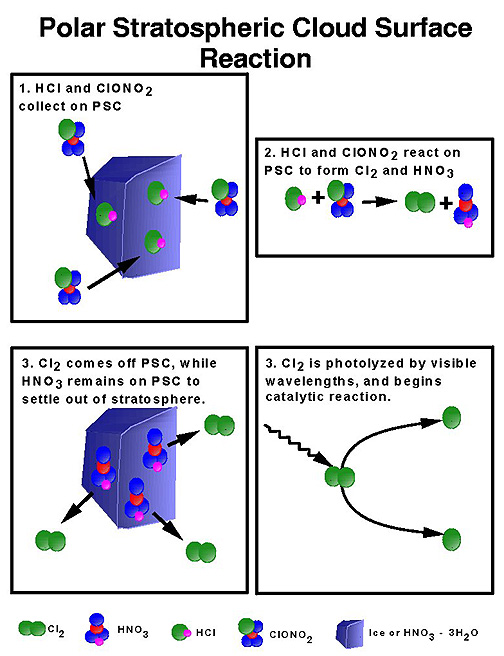
- Figure 11.46
- Schematic Diagram of Polar Stratospheric Cloud Surface
Chemistry
- Figure 11.47
- Plot of ClOx/Cly and HCl/Cly Ratios in the Antarctic Polar
Vortex on July 28, 1994
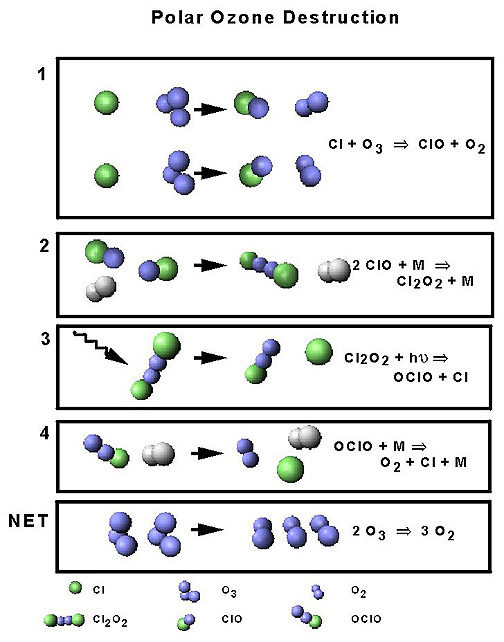
- Figure 11.48
- Schematic Diagram of Polar Ozone Destruction Reactions
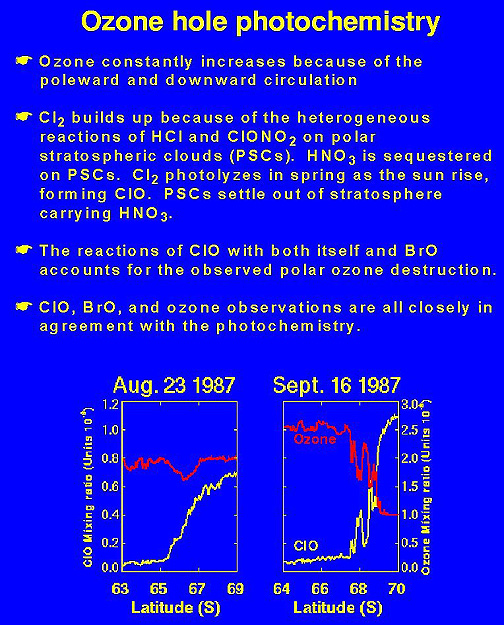
- Figure 11.49
- Ozone Hole Photochemistry Showing Ozone and Chlorine Monoxide
Concentrations
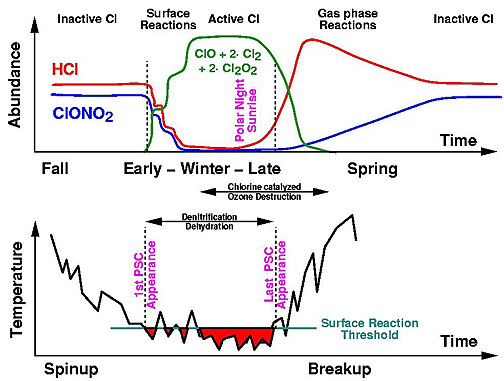
- Figure 11.50
- Schematic Diagram Showing Heterogeneous Chlorine Chemistry
Activation
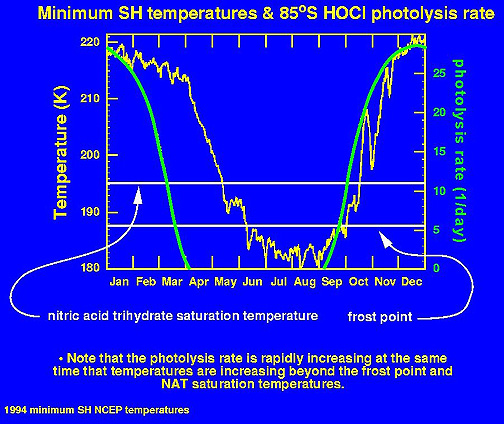
- Figure 11.51
- Minimum SH Temperatures and HOCl photolysis Rate at
85°S

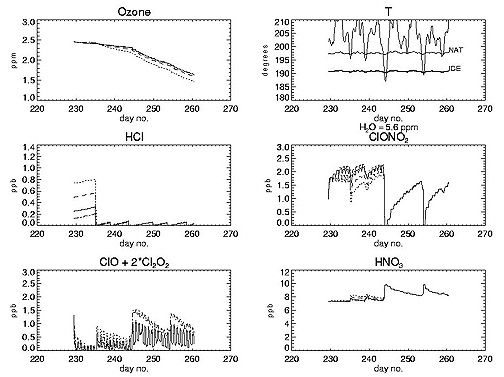
- Figure 11.52
- Chemical Evolution of Air Parcel Inside Antarctic Polar
Vortex, August 17 - September 17, 1992
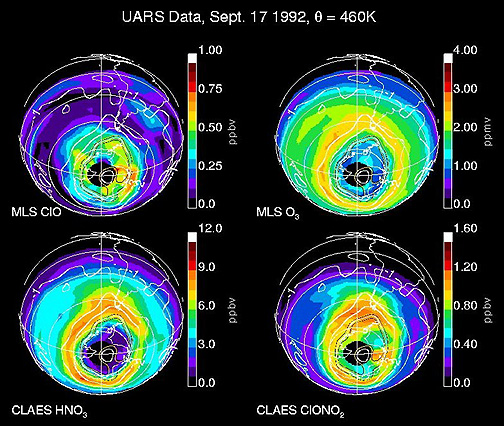
- Figure 11.53
- UARS Data Showing Antarctic Polar Vortex Trace Chemical
Constituents, Sept. 17, 1992
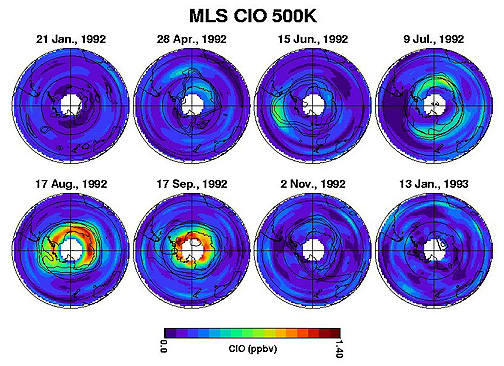
- Figure 11.54
- Evolution of ClO Concentrations Inside the Antarctic Polar
Vortex in 1992
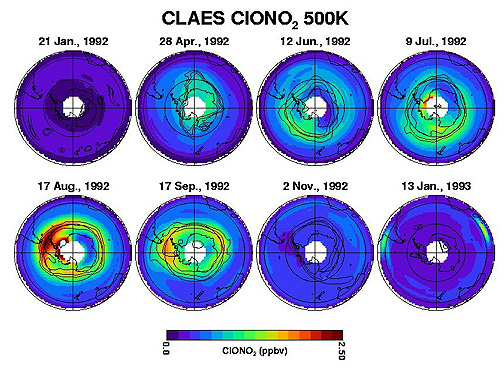
- Figure 11.55
- Evolution of ClONO2 Concentrations
Inside the Antarctic Polar Vortex in 1992
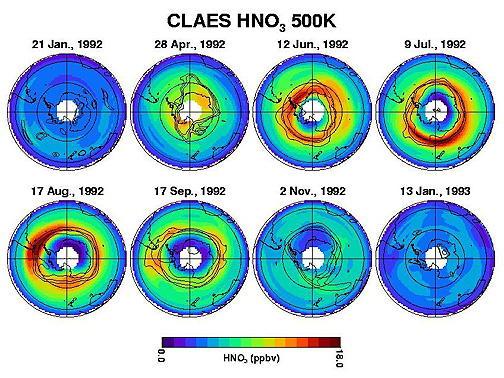
- Figure 11.56
- Evolution of Nitric Acid (HNO3) Inside
the Antarctic Polar Vortex in 1992
- Figure 11.57
- Northern Hemisphere Total Ozone for Selected March
1971-1998
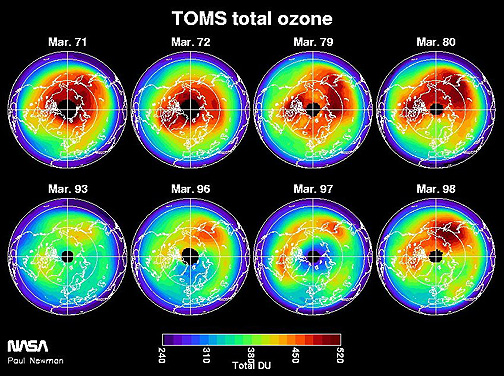
- Figure 11.58
- TOMS Northern Hemisphere Total Ozone for Selected March
1971-1998
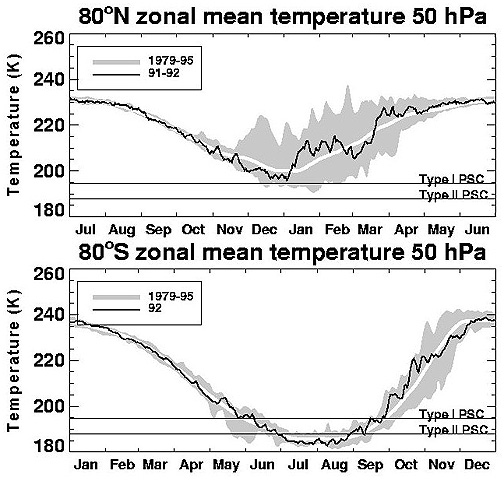
- Figure 11.59
- Zonal Mean Temperature at 80°N and 80°S at
50hPa
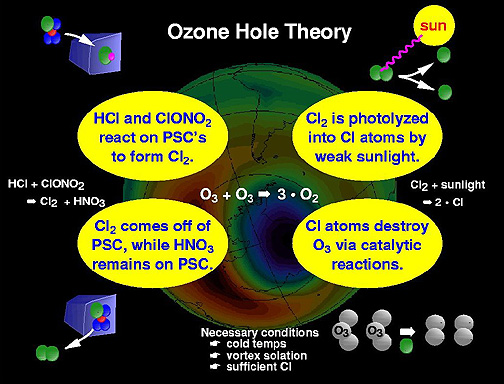
- Figure 11.60
- Schematic Diagram of Ozone Hole Theory