CHAPTER 5 FIGURES
To see full-size figures, just click the thumbnails. To download
high-resolution PDF versions for printing, please click here.
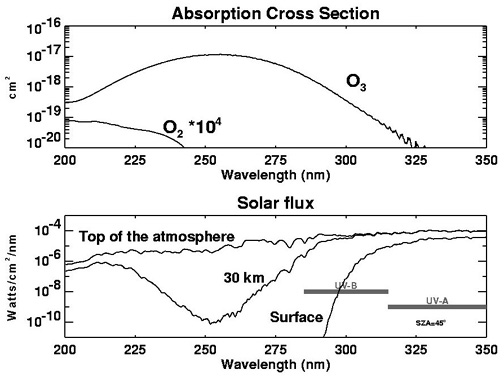
- Figure 5.01
- Absorption and photolysis of oxygen molecules by solar
radiation
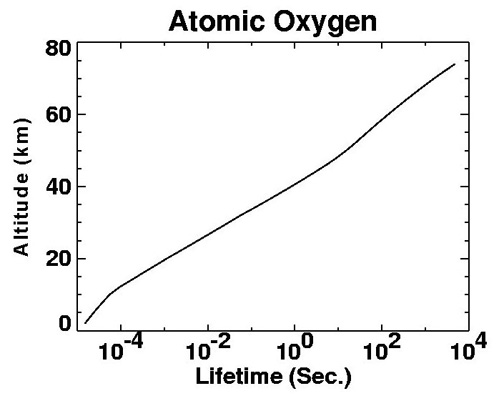
- Figure 5.02
- Calculated lifetime of oxygen atoms as a function of
altitude
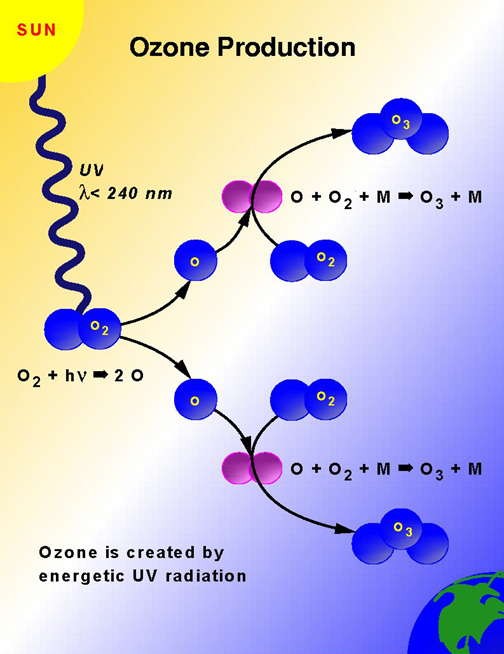
- Figure 5.03
- Ozone photochemical production
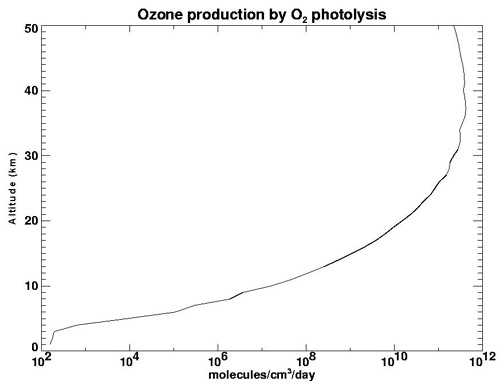
- Figure 5.04
- Ozone production by O2 photolysis
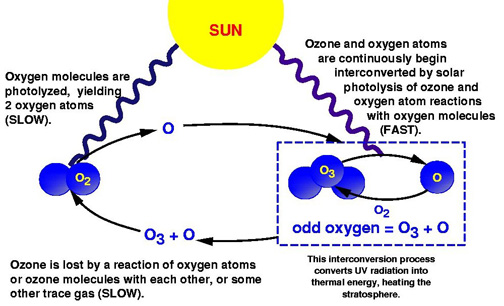
- Figure 5.05
- The Chapman ozone life cycle
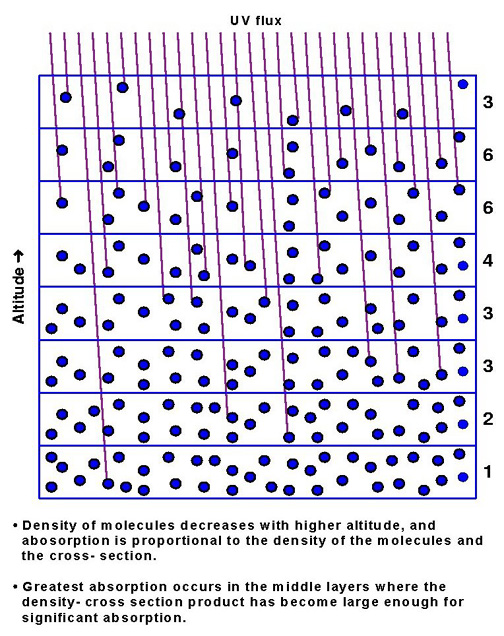
- Figure 5.06
- UV flux in terms of a steady rain of photons from the Sun
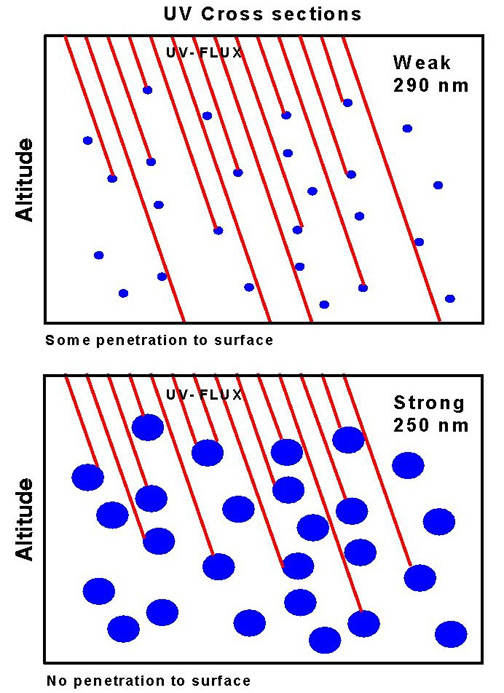
- Figure 5.07
- The altitude dependence on UV photolysis
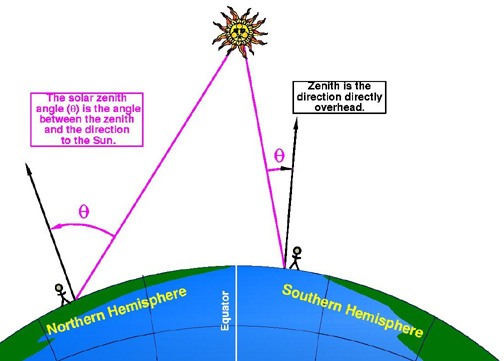
- Figure 5.08
- The dependence of photolysis on latitude for two
observers
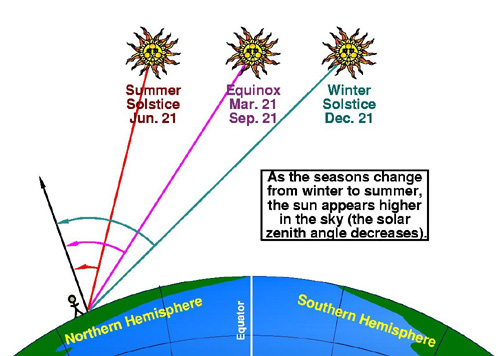
- Figure 5.09
- The dependence of photolysis on the seasons
- Figure 5.10
- The dependence of photolysis on a diurnal cycle
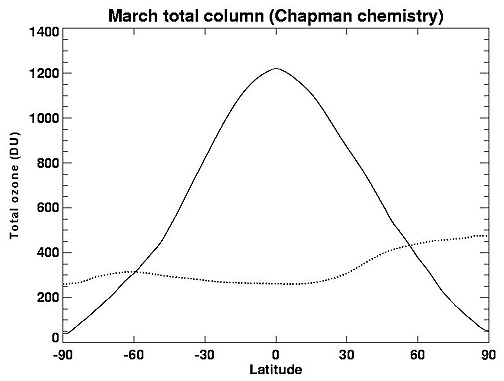
- Figure 5.11
- Total column ozone estimated using Chapman chemistry for March
21
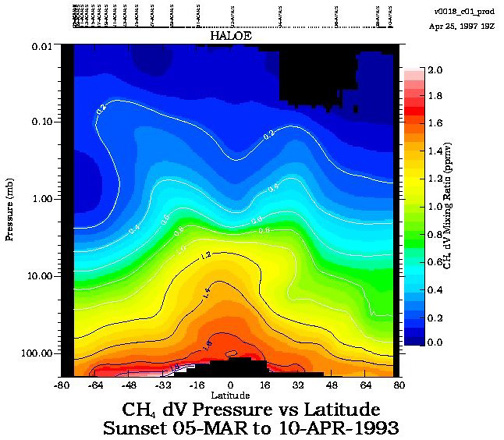
- Figure 5.12
- Typical methane distribution from HALOE, March 5-April 10,
1993
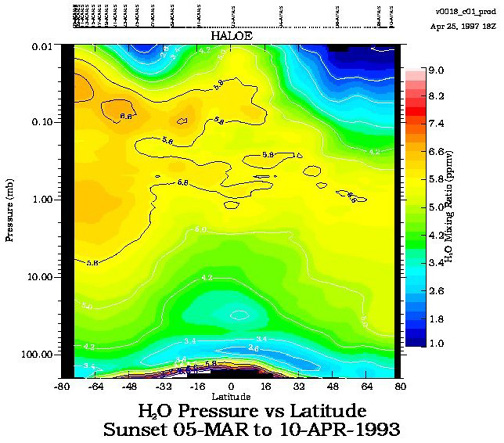
- Figure 5.13
- Typical water vapor distribution from HALOE, March-April
1993
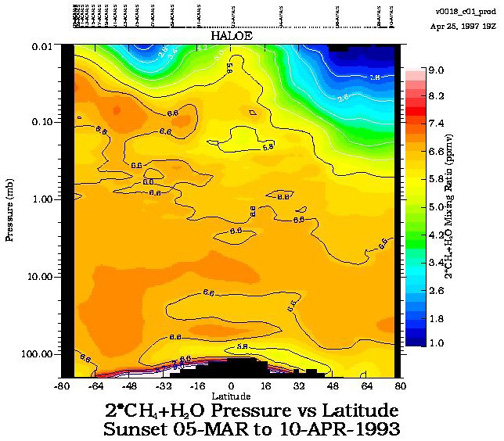
- Figure 5.14
- The sum of methane and water vapor

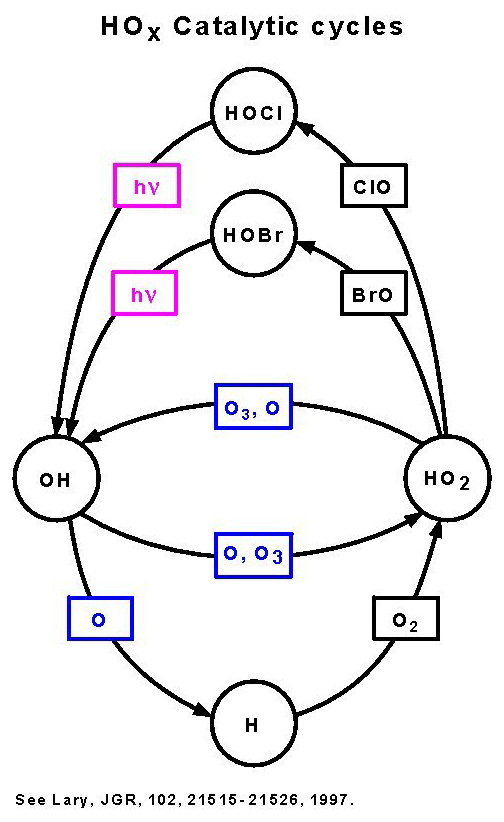
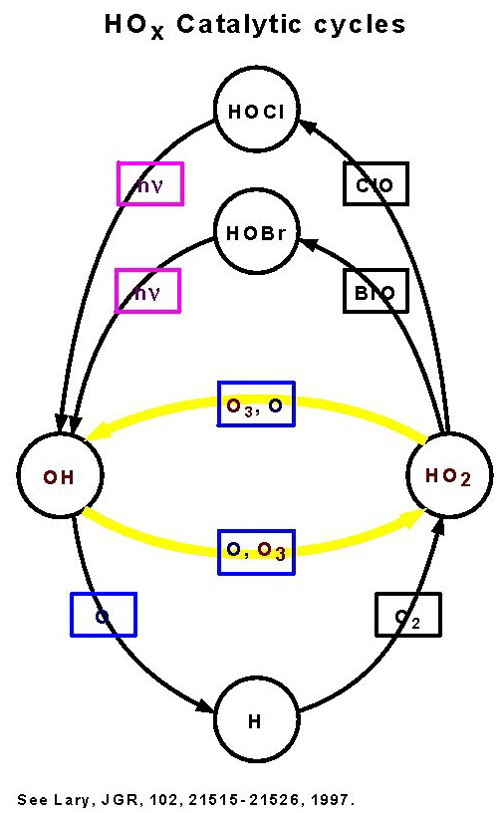
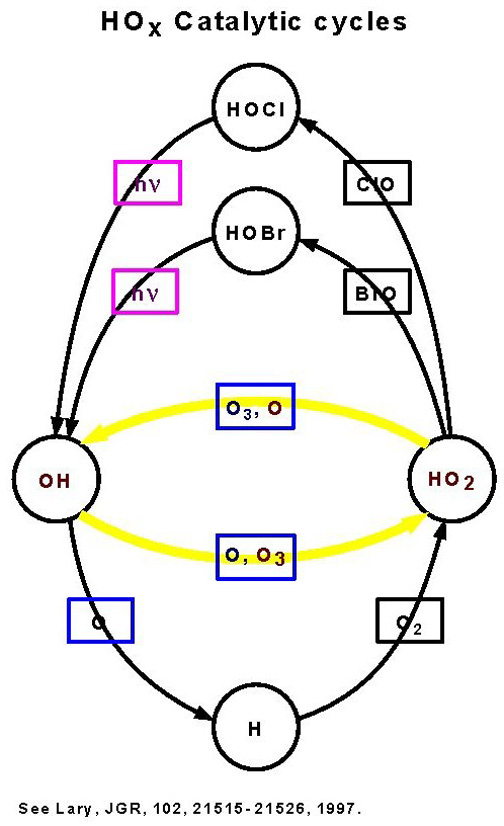
- Figure 5.15
- Reactive hydrogen cycles
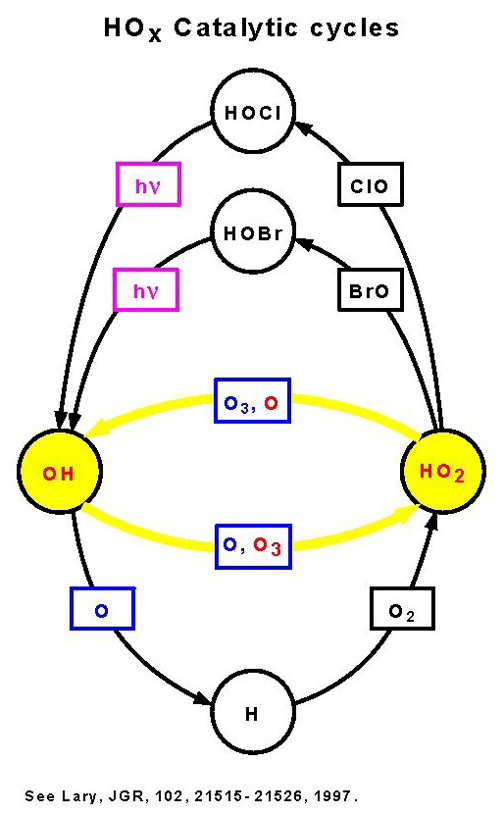
- Figure 5.15a
- Catalytic cycle in the upper stratosphere

- Figure 5.15b
- Catalytic cycle in the lower stratosphere
- Figure 5.15c
- Upper stratosphere reaction involving a free hydrogen atom as
an intermediate compound
- Figure 5.15d
- Upper stratosphere reaction involving HOx and the loss of two
odd oxygens

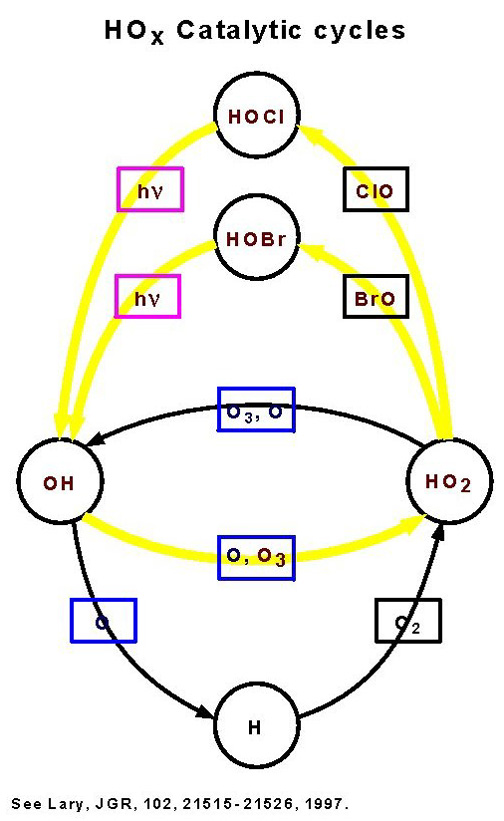
- Figure 5.15e
- Lower stratosphere cycles involving interaction with the
chlorine or bromine cycles
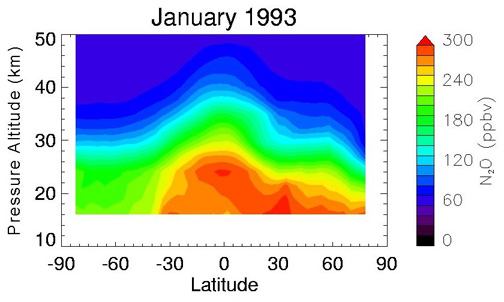
- Figure 5.16
- Typical N2O distribution in the
stratosphere as seen by CLAES, January 1993
- Figure 5.17
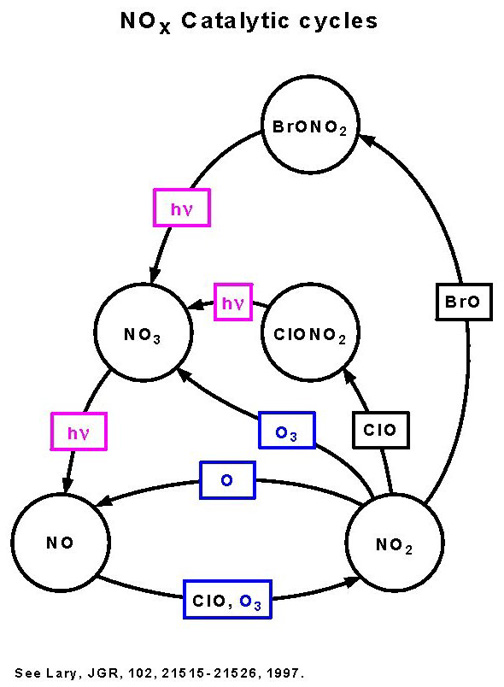
- Chemical processes of some nitrogen oxides
- Figure 5.18
- Reactions of reactive forms of nitrogen
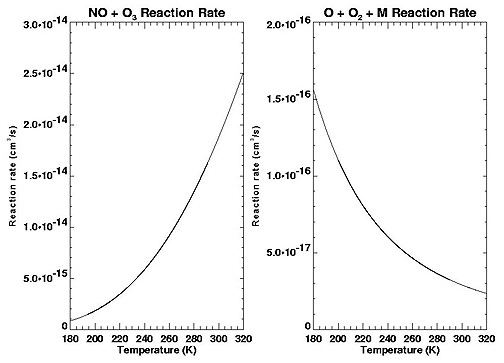
- Figure 5.19
- Temperature dependence of reactions between chemical
species
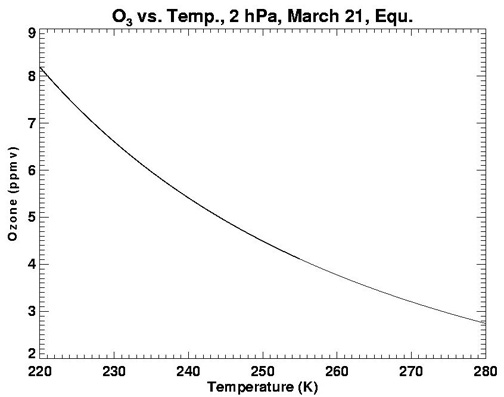
- Figure 5.20
- Ozone concentration as a function of temperature and
NOX

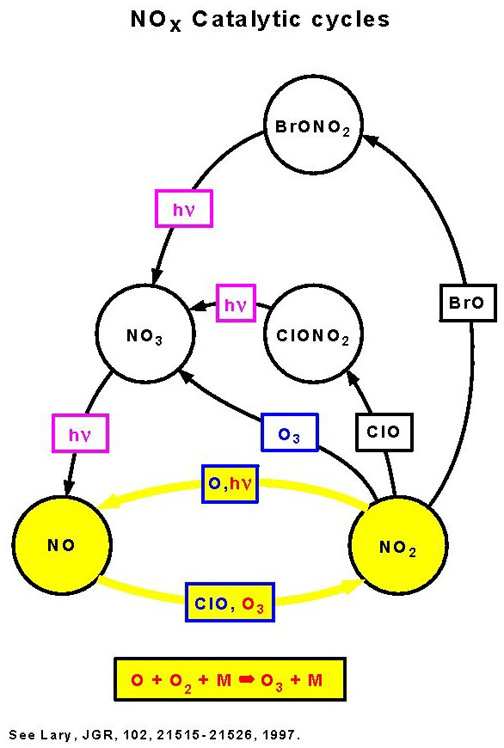
- Figure 5.21
- An interference cycle
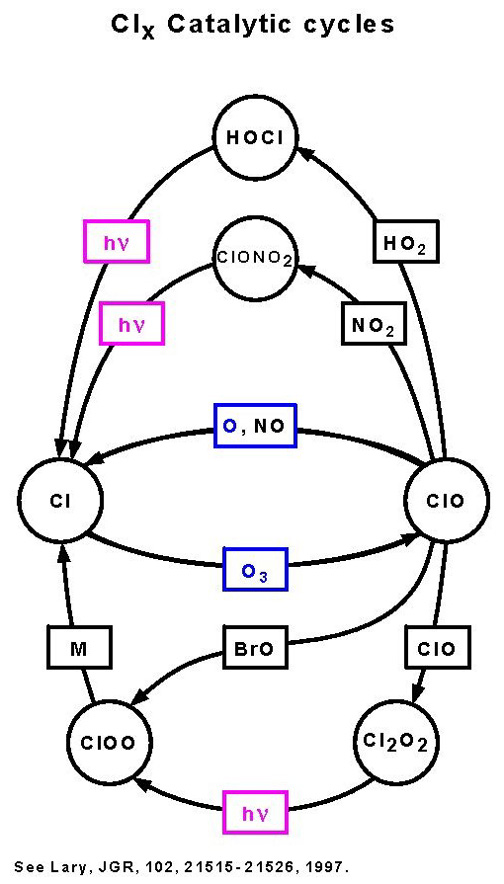
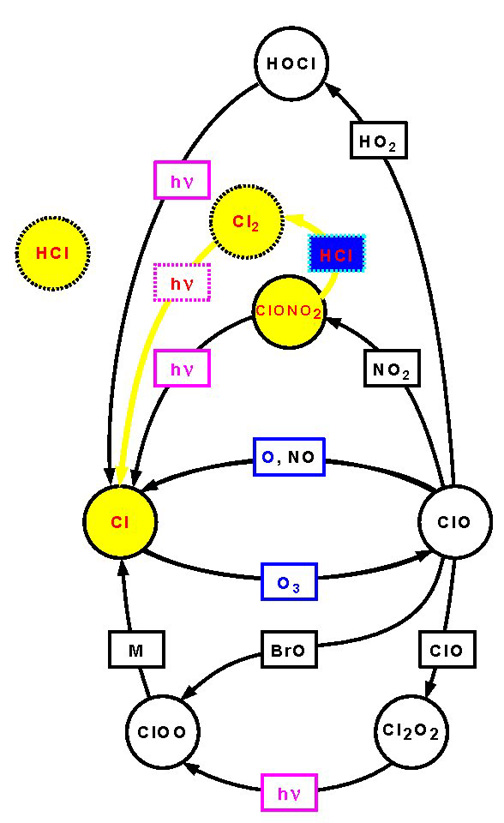
- Figure 5.22
- Chemical reactions of different chlorine-containing
molecules
- Figure 5.23
- The Cl/ClO reaction
- Figure 5.24
- Photolysis of NO3 and
ClONO2
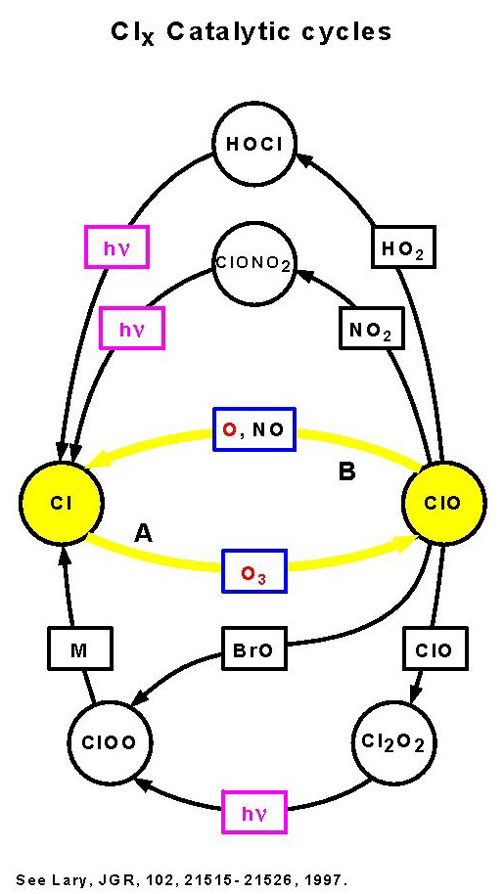
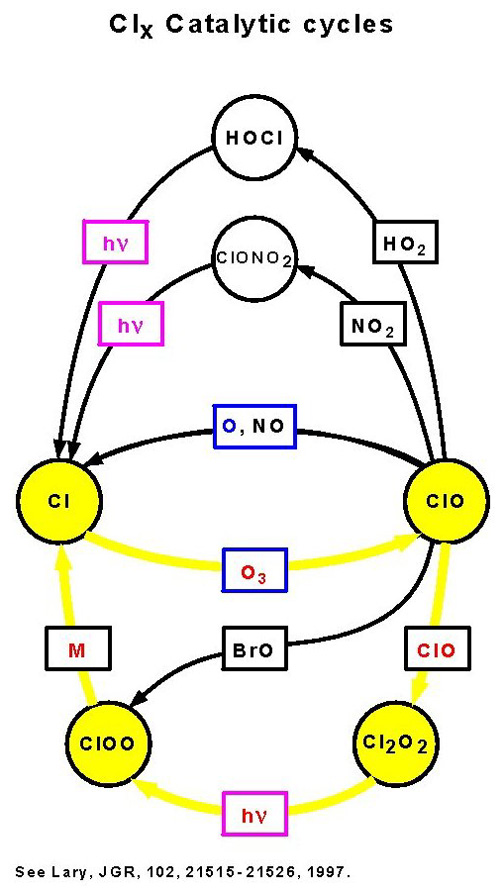
- Figure 5.25
- Second ClX catalytic cycle

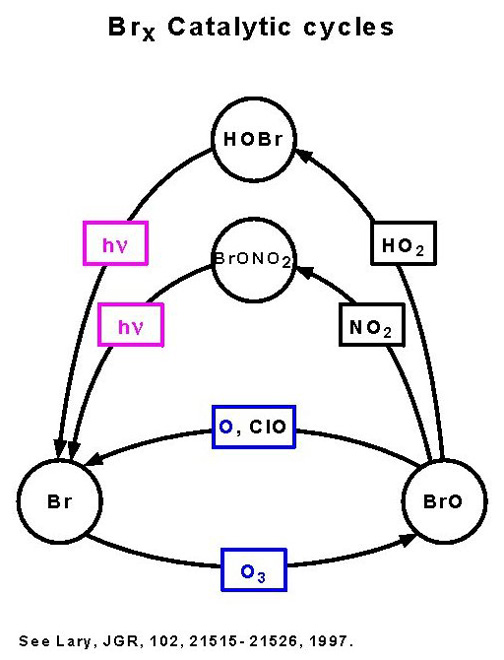
- Figure 5.26
- Chemical processes for bromine
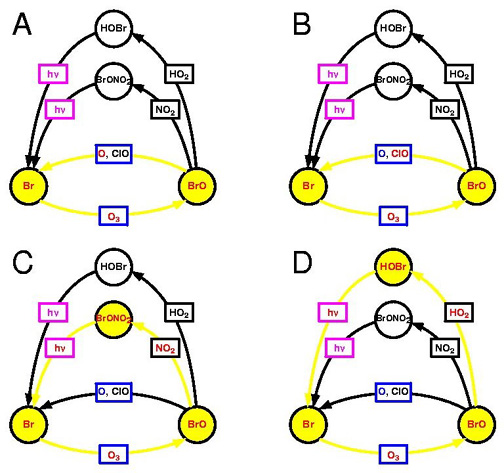
- Figure 5.27
- The four distinct catalytic cycles for ozone loss
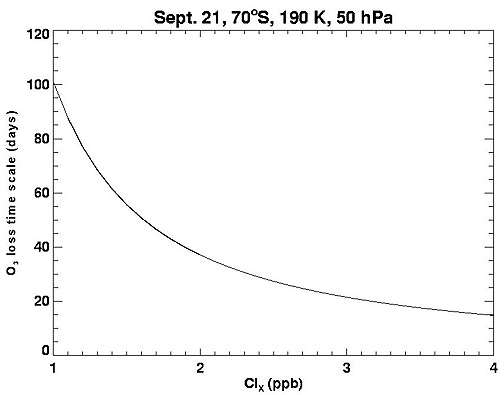
- Figure 5.28
- Ozone loss time scale at 70%S, alt. 20km, pressure level 50mb
or 50hPa
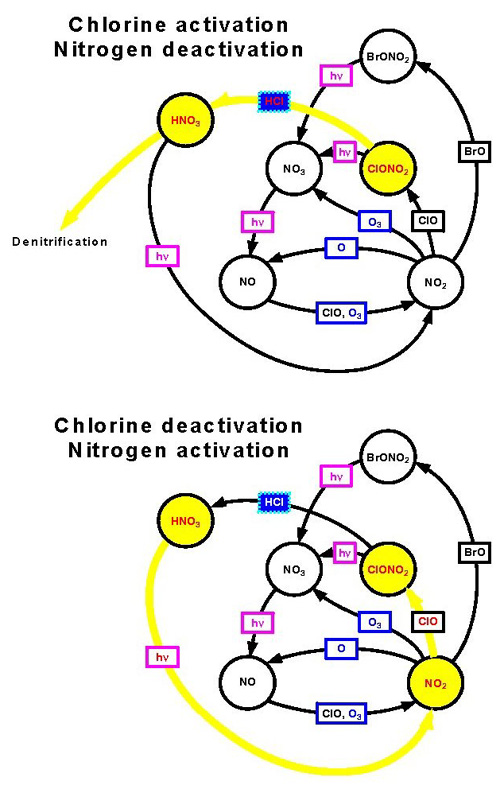
- Figure 5.29
- Added pathway for activating chlorine because of the
heterogeneous chemistry
- Figure 5.30
- How reactive nitrogen is locked away as
HNO3