CHAPTER 6 FIGURES
To see full-size figures, just click the thumbnails. To download
high-resolution PDF versions for printing, please click here.
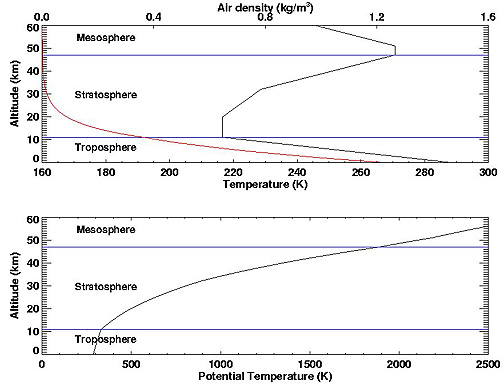
- Figure 6.01
- Density and temperature profile and potential temperature
profile from Earth's surface to 60 km
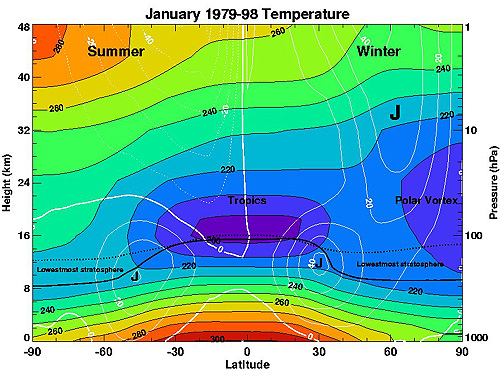
- Figure 6.02
- January 1979-1998 zonally averaged temperature as a function
of height
- Figure 6.03
- Schematic diagram of Brewer-Dobson circulation with seasonally
averaged ozone density
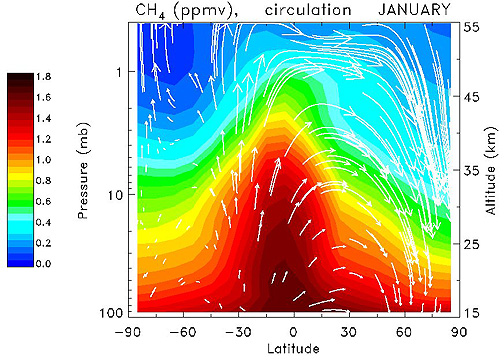
- Figure 6.04a
- Zonally averaged methane concentrations (in ppmv) and the
Brewer-Dobson circulation for January
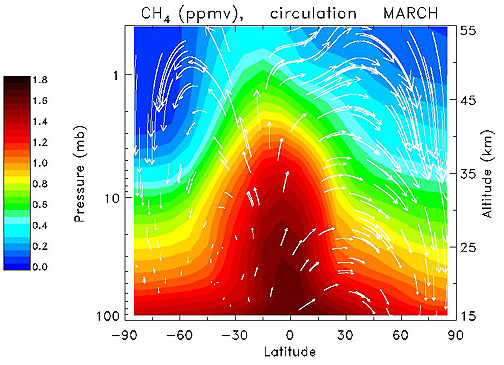
- Figure 6.04b
- Zonally averaged methane concentrations (in ppmv) and the
Brewer-Dobson circulation for March
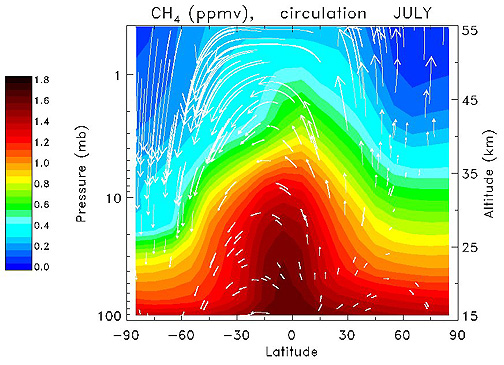
- Figure 6.04c
- Zonally averaged methane concentrations (in ppmv) and the
Brewer-Dobson circulation for July
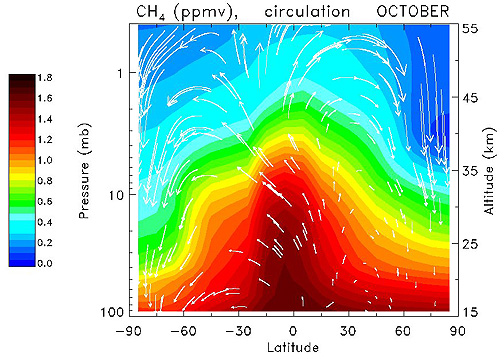
- Figure 6.04d
- Zonally averaged methane concentrations (in ppmv) and the
Brewer-Dobson circulation for October
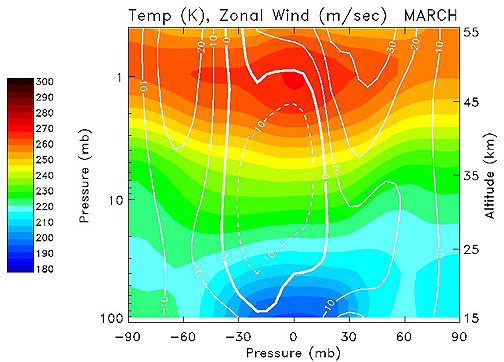
- Figure 6.05a
- Zonal temperature and wind fields for March
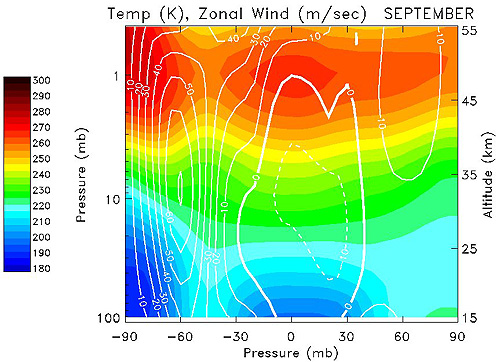
- Figure 6.05b
- Zonal temperature and wind fields for September
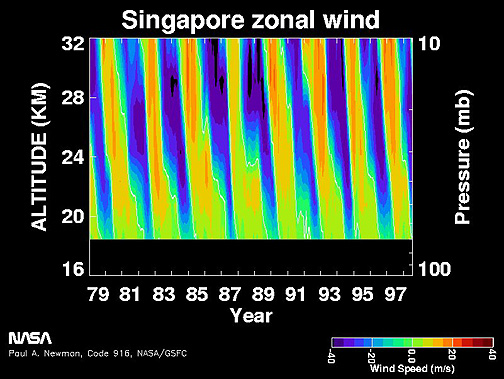
- Figure 6.06
- Singapore zonal winds showing the Quasi-Biennial Oscillation
effect
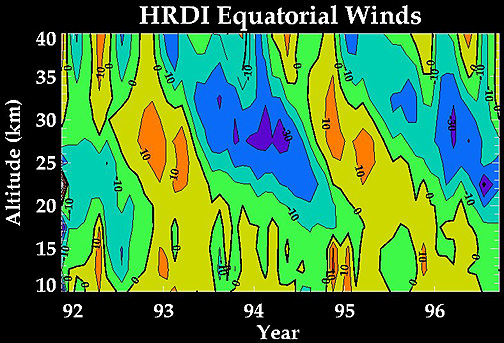
- Figure 6.07
- HRDI derived equatorial zonal winds for 1992-1996
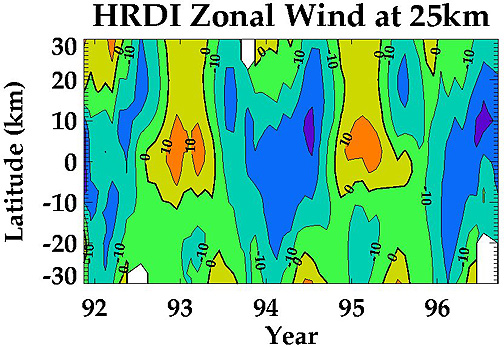
- Figure 6.08
- HRDI derived zonal winds at 25 km from 30°S to 30°N
for 1992-1996
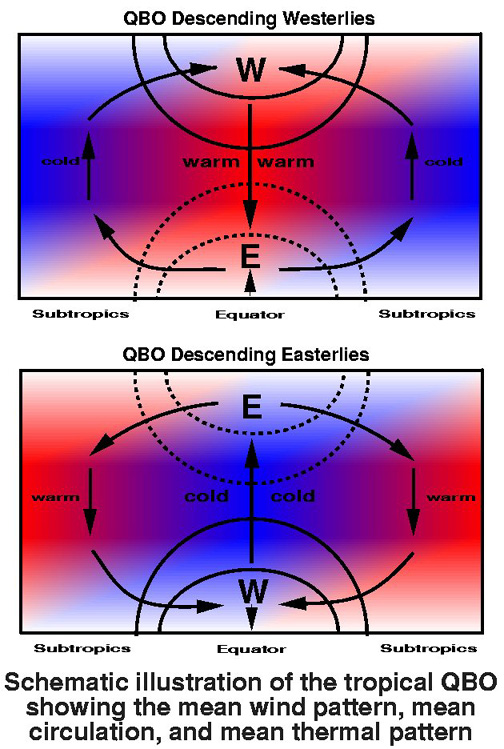
- Figure 6.09
- Schematic diagram of the QBO descending westerlies (top panel)
and descending easterlies (bottom panel) phases
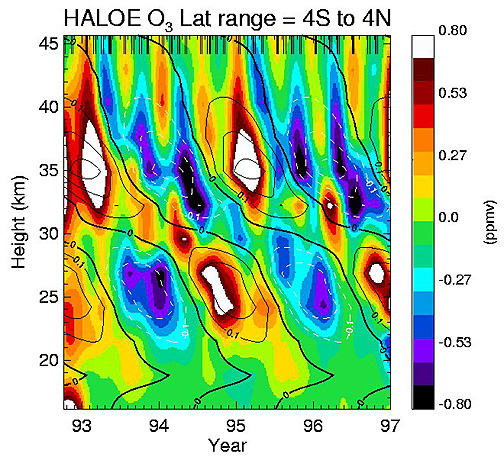
- Figure 6.10
- HALOE derived ozone anomalies from 4°S to 4°N for
1993-1997 with HRDI derived zonal winds superimposed
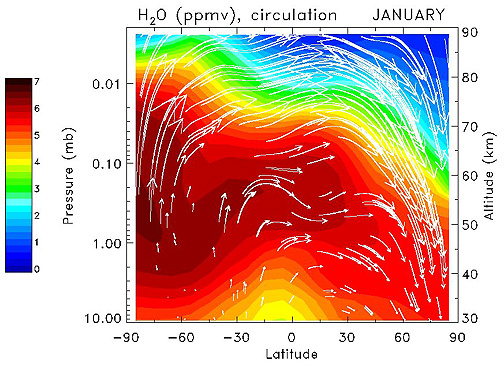
- Figure 6.11
- Zonally averaged water vapor distribution for January for
stratosphere and mesosphere with superimposed mean meridional
circulation
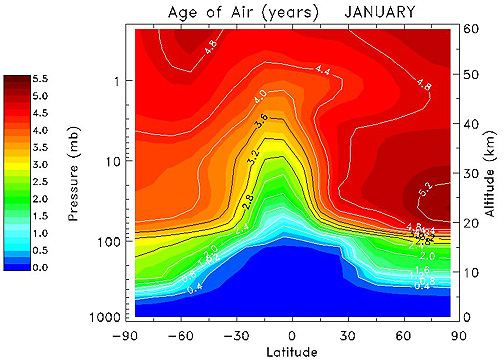
- Figure 6.12
- Transport model derived, zonally averaged "age of air" for
January
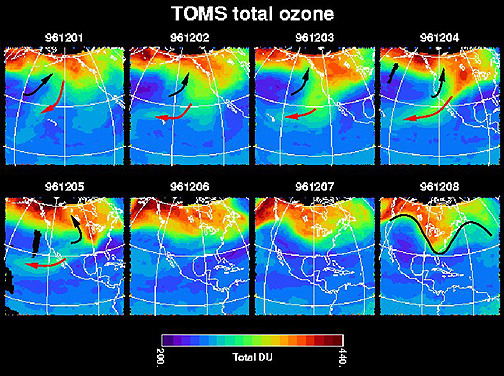
- Figure 6.13
- Daily total ozone over eastern Pacific and North America,
December 1-8, 1996, showing mixing process due to large-scale
synoptic weather system
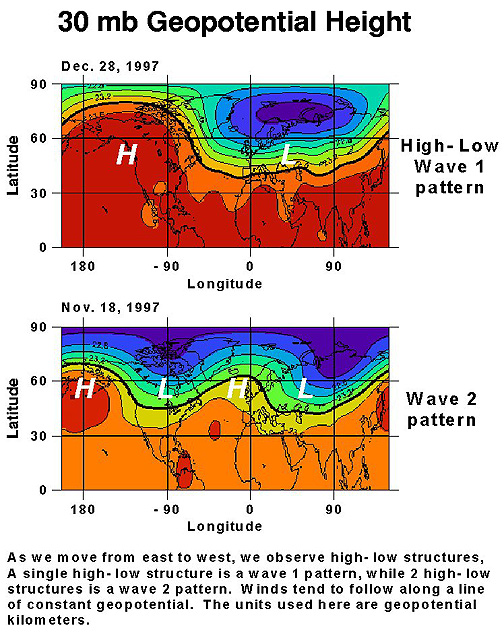
- Figure 6.14
- The 30 mb geopotential height field for December 28, 1997 (top
panel) and November 18, 1997 (bottom panel) illustrating planetary
wave-1 and planetary wave-2 patterns at 60°N
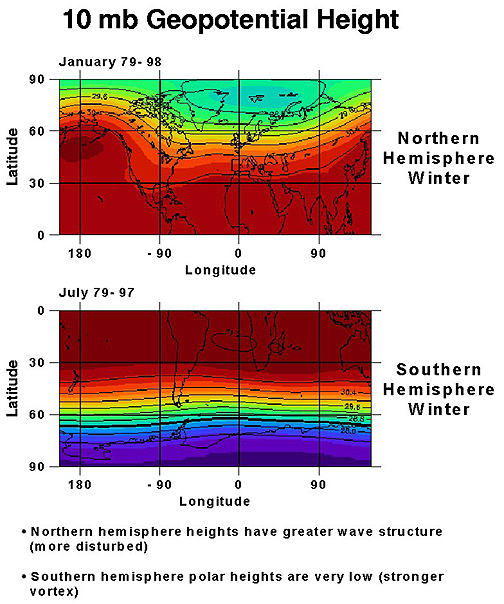
- Figure 6.15
- The climatological average wintertime 10 mb geopotential
height field for the northern hemisphere (top panel) and the
southern hemisphere(bottom panel)
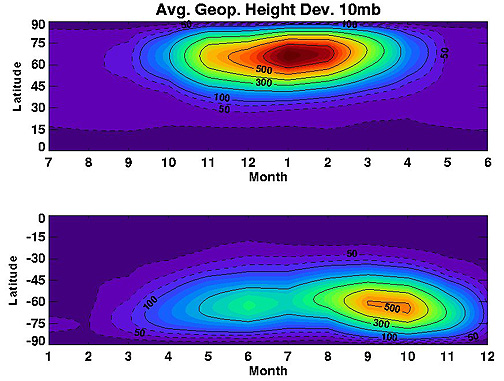
- Figure 6.16
- Average monthly amplitude of deviations in the 10 mb
geopotential height field for a full year for northern hemisphere
(top panel) and southern hemisphere (bottom panel)--time axes
shifted for comparison of northern and southern hemisphere
winters
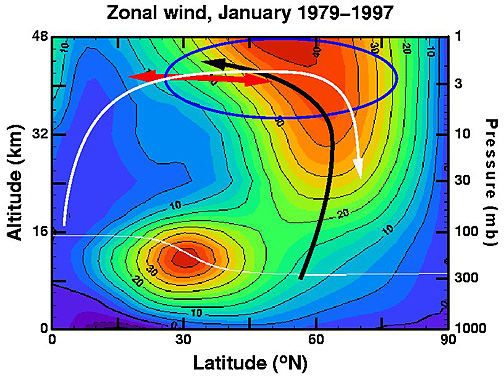
- Figure 6.17
- January zonal wind (1979-1997 average) for the northern
hemisphere showing vertical propagation of planetary waves into
the stratosphere
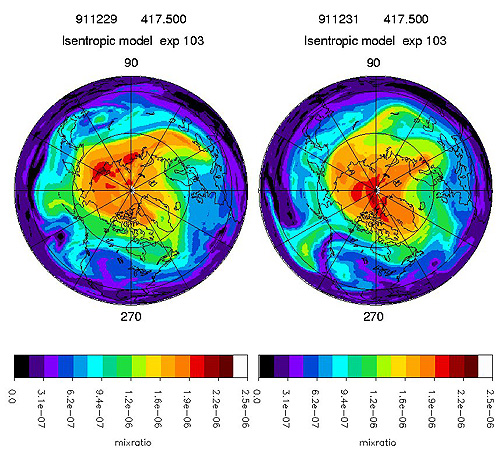
- Figure 6.18
- 3-D transport model of ozone mixing into and out of the polar
vortex on the 417K isentropic surface between December 29, 1991
(left), and December 31, 1991 (right)
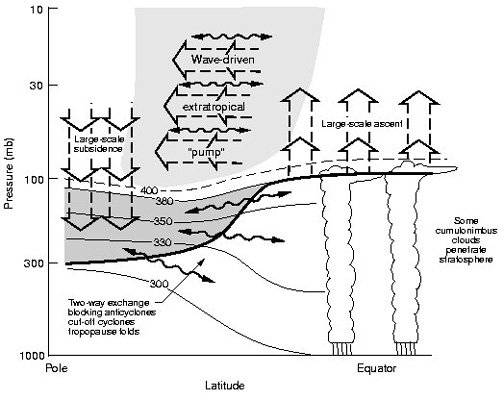
- Figure 6.19
- Schematic diagram of transport processes in the stratospheric
overworld and lowermost regions