CHAPTER 9 FIGURES
To see full-size figures, just click the thumbnails. To download high-resolution PDF versions for printing, please click here.
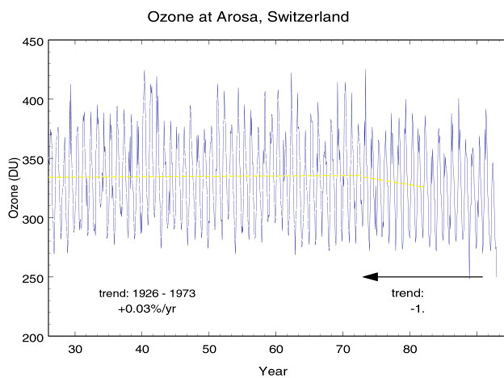
Figure 9.01a
1926-1997 raw Dobson data from Arosa, Switzerland
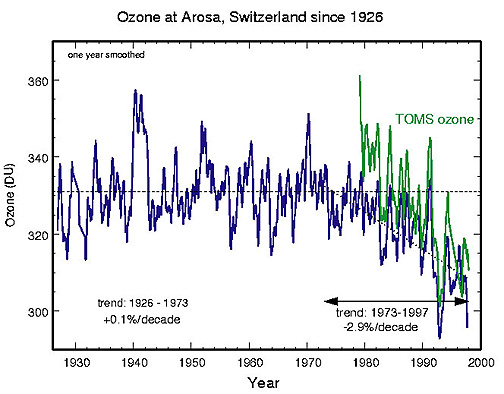
- Figure 9.01b
- Smoothed total ozone measurements at Arosa, Switzerland since 1926
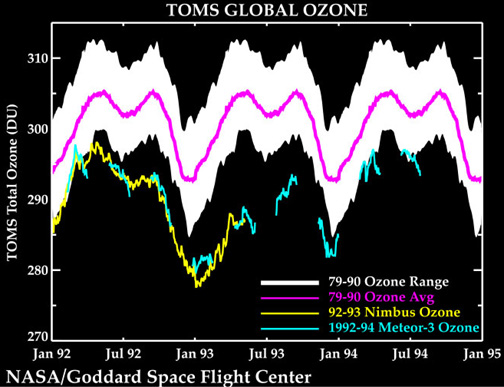
- Figure 9.02a
- Global average, weekly average time series of total ozone from TOMS
- Figure 9.02b
- Comparing global TOMS monthly averages from the early '90s to all global data from '79-'90
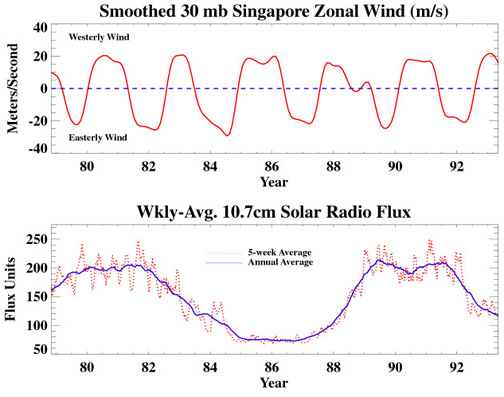
- Figure 9.03
- Smoothed 30mb Singapore zonal wind (panel A) and 10.7 cm solar radio flux (panel B)
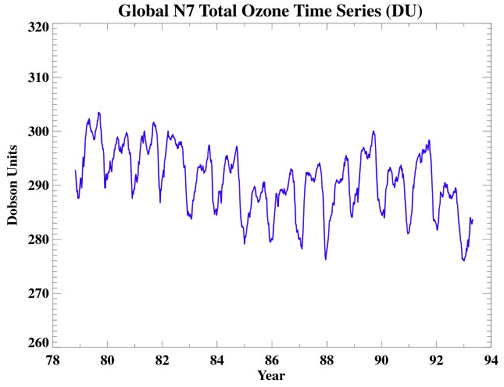
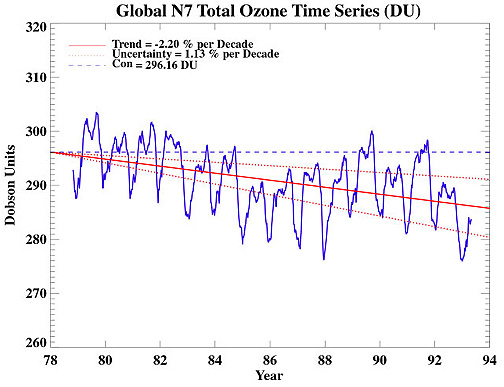
- Figure 9.04a
- Global Nimbus-7 total ozone time series
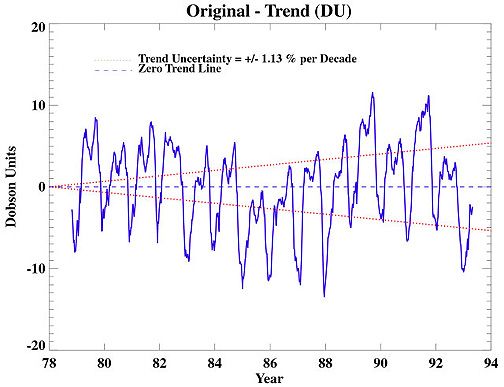
- Figure 9.04b
- Original - trend, 1978-1994
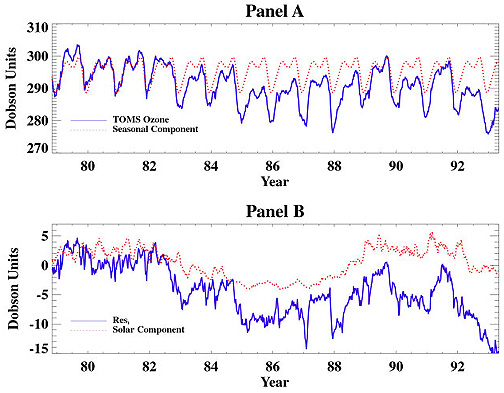
- Figure 9.05a
- Estimated seasonal cycle of global ozone and TOMS total ozone (panel A) and residual not accounted for by seasonal cycle of ozone and the solar cycle (panel B)
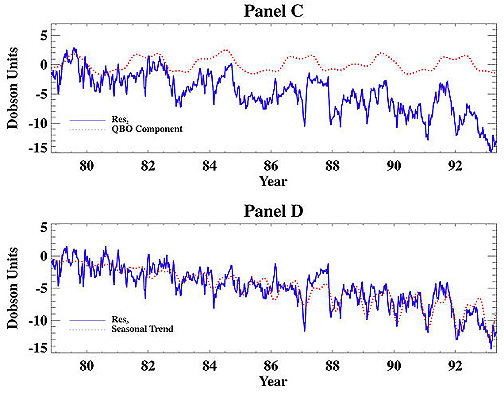
- Figure 9.05b
- Residual not accounted for by seasonal or solar cycle and the QBO cycle (panel C) and residual not accounted for by seasonal, solar, or QBO cycles and the long-term seasonal trend cycle (panel D)
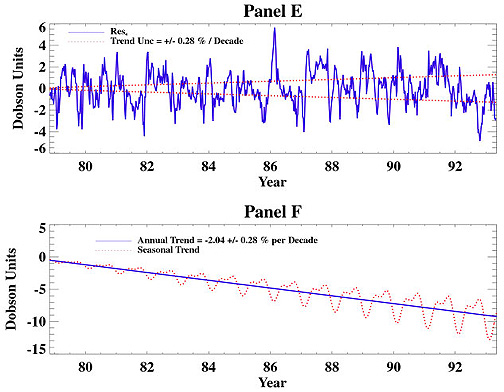
- Figure 9.05c
- Residual not accounted for any of our four previous components (panel E) and annual trend in total ozone and seasonal trend (panel F)
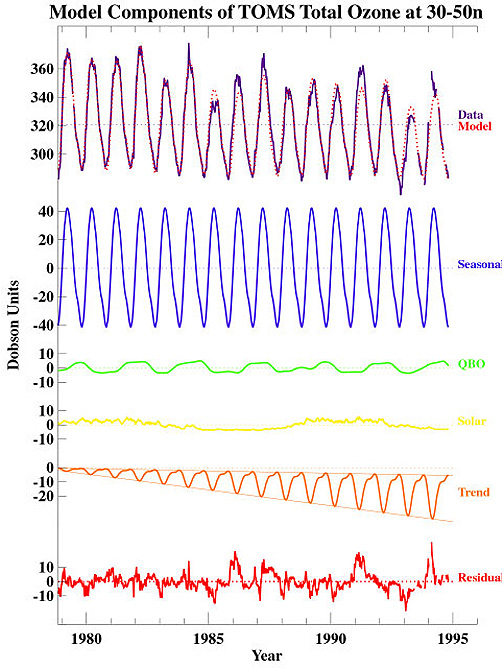
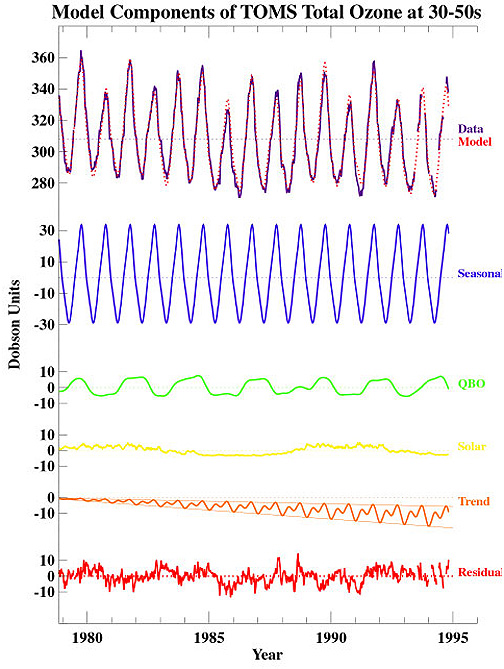
- Figure 9.06a
- Model components of TOMS total ozone at 30-50N
- Figure 9.06b
- Model components of TOMS total ozone at 30-50S
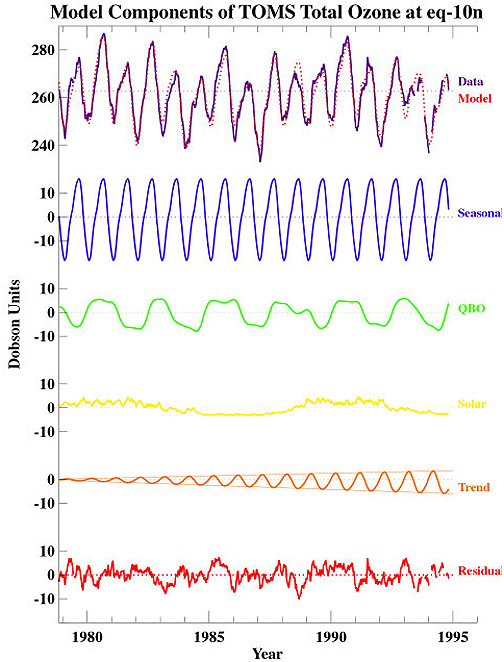
- Figure 9.06c
- Model components of TOMS total ozone at EQ-10N
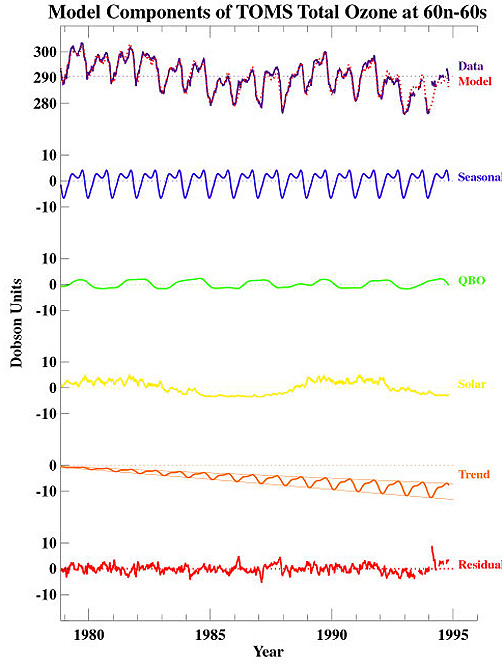
- Figure 9.06d
- Model components of TOMS total ozone at 60N-60S
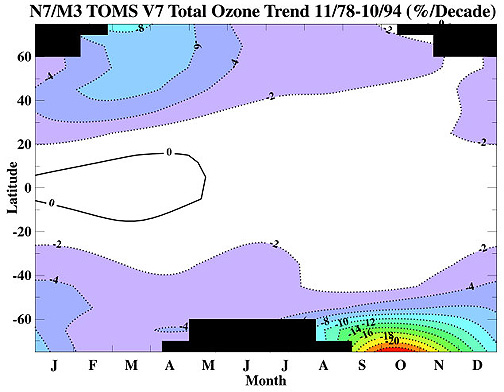
- Figure 9.07
- Nimbus-7/Meteor-3 total ozone trend, 11/78-10/94
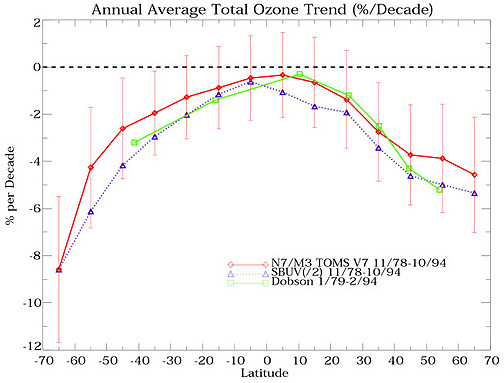
- Figure 9.08
- Annual average total column ozone trends (in % per decade) as a function of latitude, 11/78-10/94
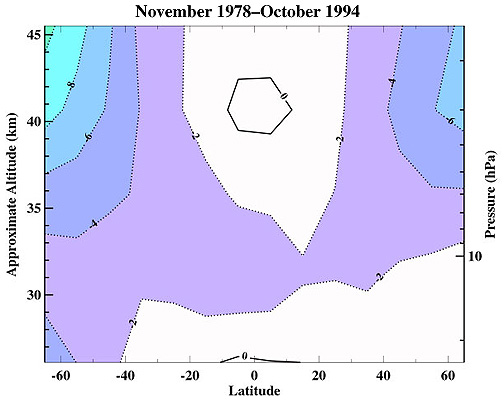
- Figure 9.09
- Nimbux-7/NOAA-11 SBUV/2 estimated average ozone trend (in % per decade) as a function of latitude and altitude, 11/78-10/94
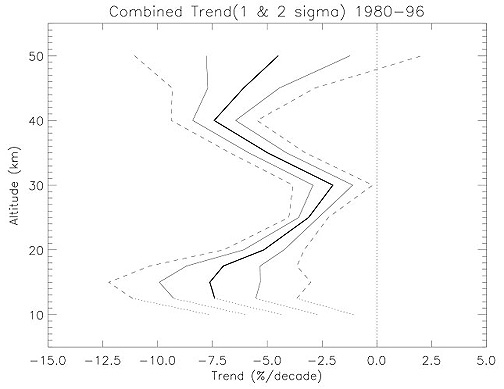
- Figure 9.10
- Combined estimate of profile trends in % per decade, 1980-1996, at the 1- and 2-sigma uncertainty level
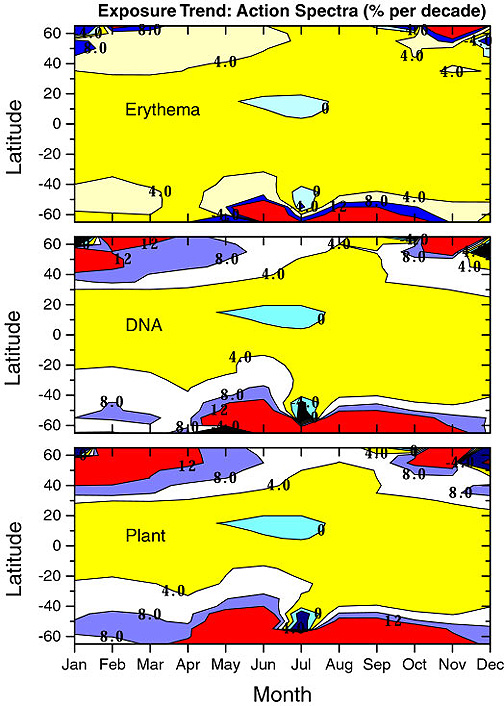
- Figure 9.11
- Exposure trend: action spectra (in % per decade)
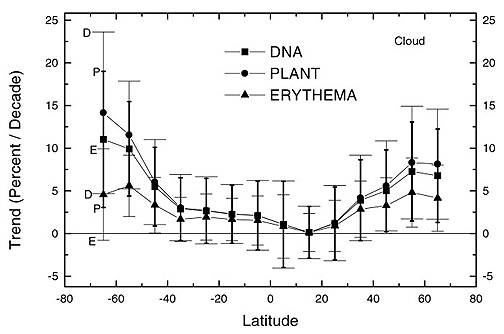
- Figure 9.12
- Annual mean exposure trends (in % per decade)
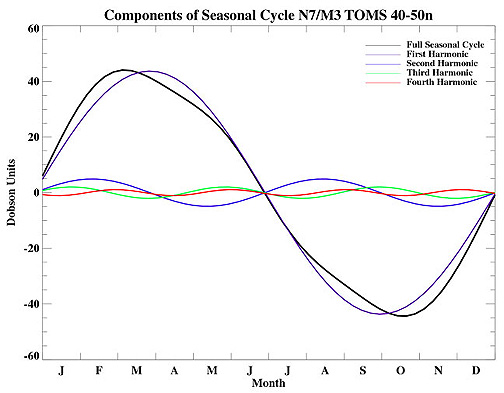
- Figure 9.13a
- Seasonal cycle of ozone over 1 year using four harmonics for 40-50°N
-
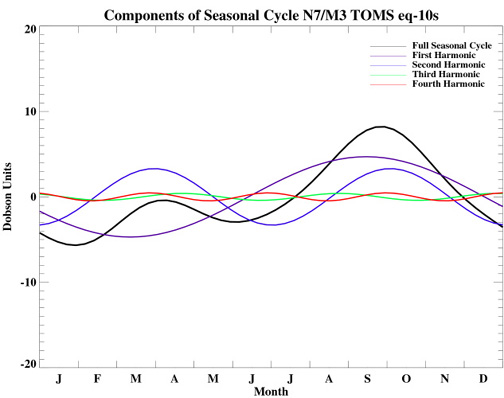
- Figure 9.13b
- Seasonal cycle of ozone over 1 year using four harmonics for EQ-10°S