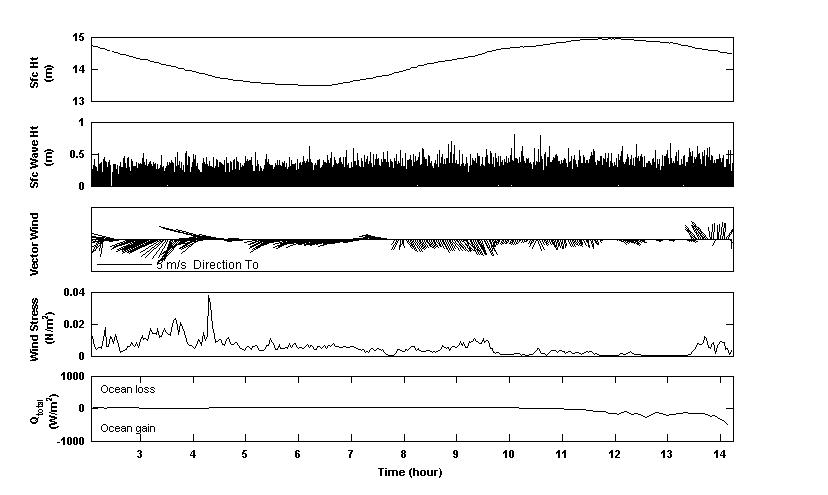
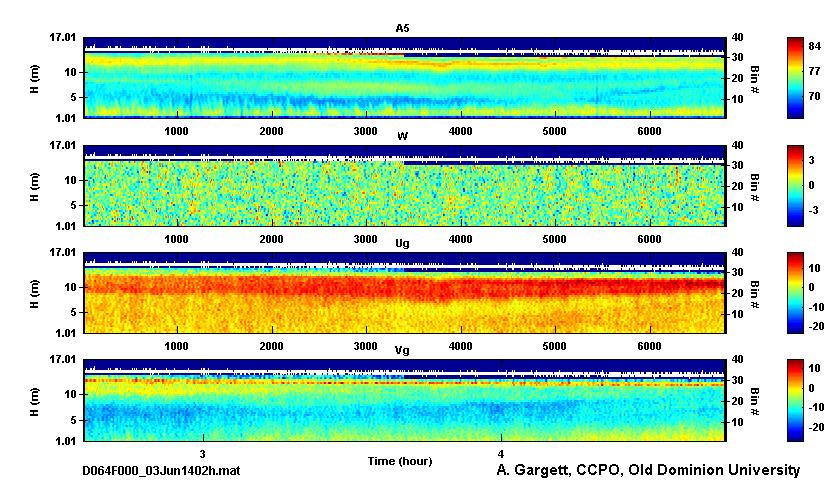
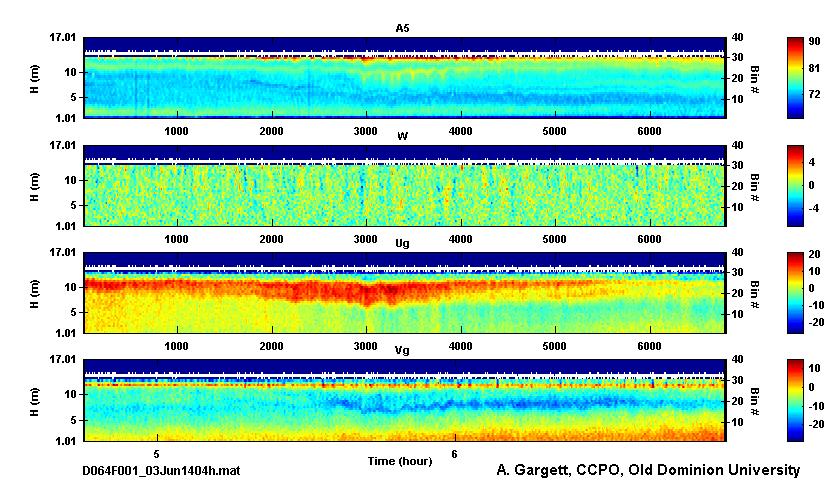
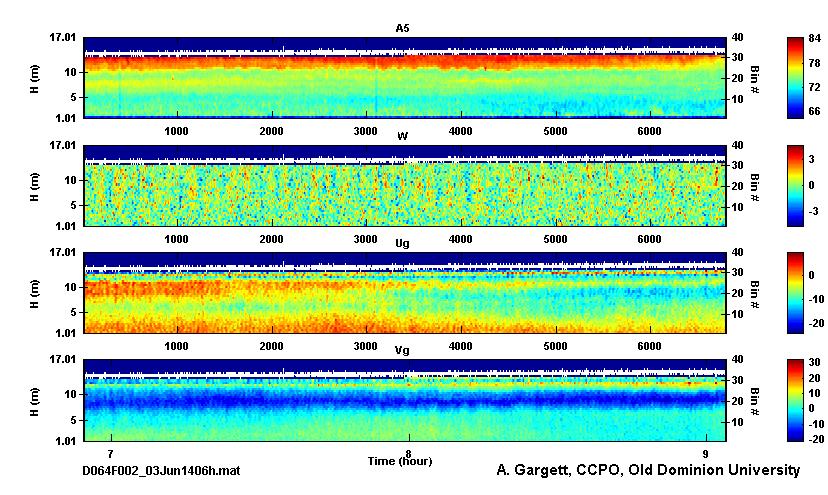
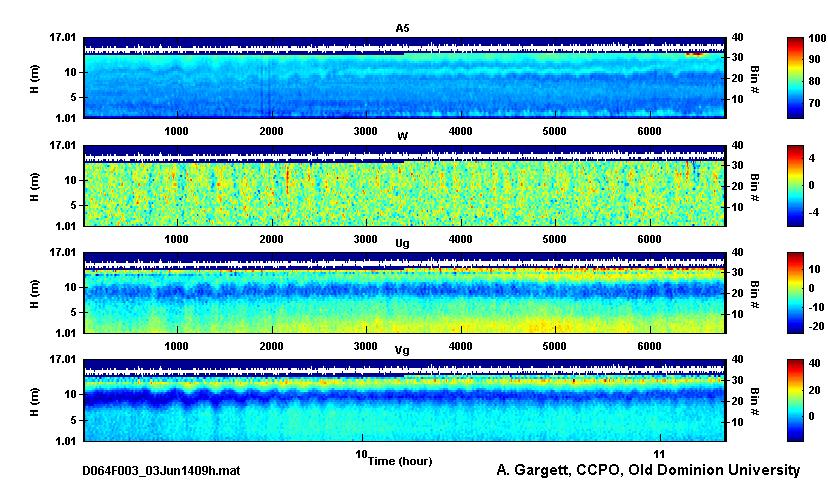
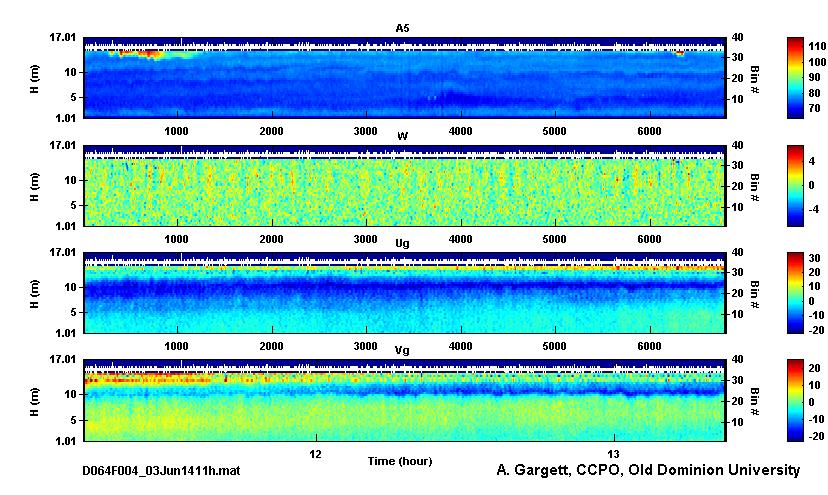
At the top of the page for each day, you will see time series of mean water level, surface wave height and important meteorological parameters. Below these are sets of 4 color-coded fields from consecutive VADCP files (each corresponding to roughly 2.2 hour), displayed as functions of H = height above bottom. Files can be located in the ancillary plots through the time axes. Individual panels display (top to bottom):
A5 = backscatter amplitude from the vertical beam,
w = true vertical velocity from the vertical beam,
Ug = E(+)/W velocity and
Vg = N(+)/S velocity calculated from the slant beam pairs.
In each panel, a white curve denotes the surface height as identified in the verticalbeam amplitude field.
You are offered a choice of scaling for the display of the water column fields:
Auto-scale reveals the most detail in individual records,
Fixed-scale facilitates comparisons between different records.