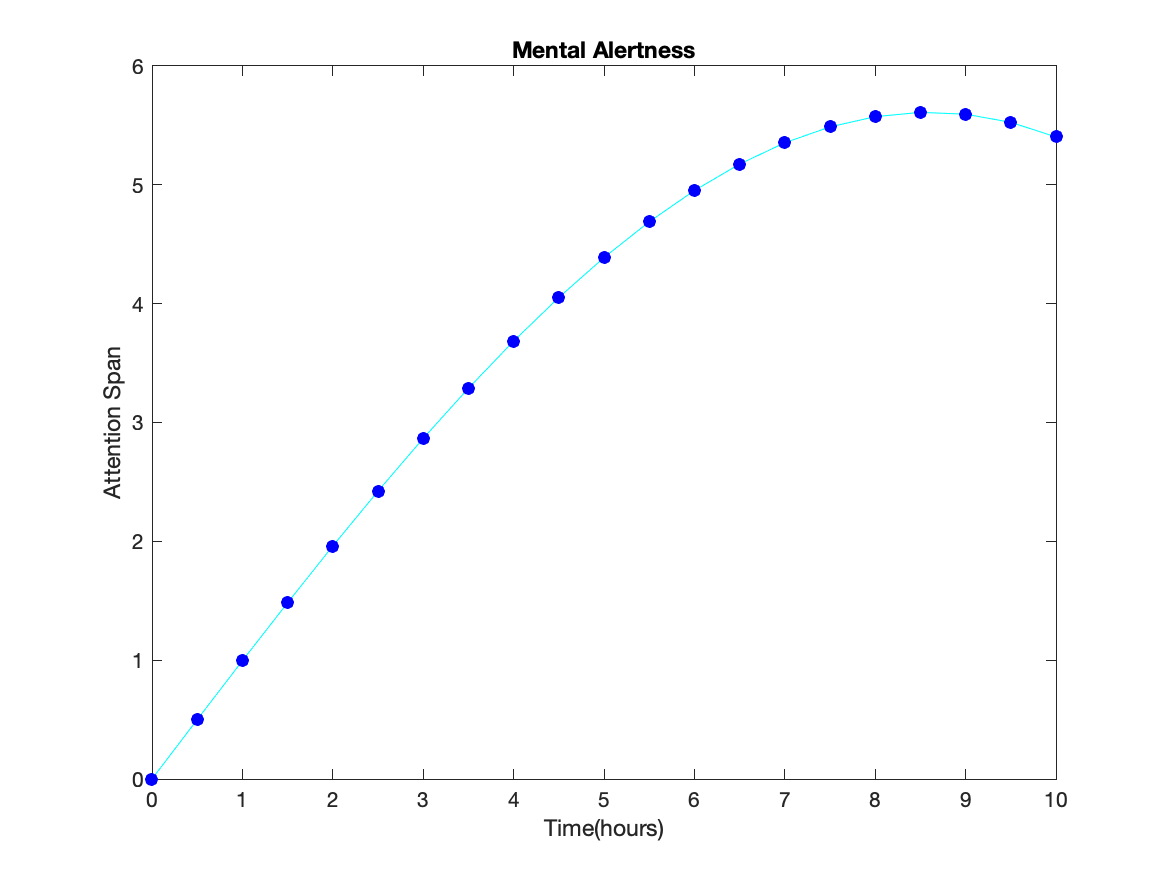
Task: Create a simple line plot with appropriate labels using the arrays below. Save the handles for the line in the plot. Set properties so that the line is cyan with blue circles (as Markers). Create arrays t=0:.5:10; and F=t.*cos(.1*t); for use in creating the figure.
MATLAB is written in an object-oriented language (in C++) which means that variables have properties associated with their object type. The various parts of the graphs that are created (labels, lines, etc) have properties that can be modified.
Each variable and graphics object has a "handle" (a name or identifier) that allows you to address that particular object and manipulate its characteristics in certain ways. The handle is actually a structure with many variables. Details will become clearer below with some examples.
A given graphics command will return the value of the handle if a variable name is provided as follows:
  Hp=plot(x,y);
  Hx=xlabel('time');
  Hy=ylabel('weight');
  Ht=title('Weight vs Time');
In this simple fragment, a line plot is created using four commands. Each
command returns a handle. My convention is to start handles with
an upper case "H" followed by lower case letters that are
descriptive; but, you can name the handle variables
anything that you like.
Graphics objects can be Line, Axis, Figure, and Text objects, among a number of others. This task will focus on the Line object; the others will be discussed in the following sub-tasks. Not surprising, a plot command creates Line objects.
The handle is a structure, so typing the name (for example, Hp from above), will give a partial list of the properties (variables) in the structure. The current style of MATLAB is to print a few of the properties in response to typing the handle name. There is a link at the end which provides all of the properties. Note that some objects have 30 to 100 properties.
In contrast to some graphics routines, MATLAB requires that you create the plot first, then change the properties.
Lines have a large number of properties. We are only concerned with a few of them now. Documentation provides a list of properties and possible choices. We are concerned with the properties: LineWidth, LineStyle, Color, Marker, MarkerSize,MarkerEdgeColor, MarkerFaceColor, and Visibility.
  Hp=plot(x,y);
  set(Hp,'LineWidth',2,'Color','r');
  set(Hp,'Marker','o','MarkerSize',8);
  set(Hp,'MarkerEdgeColor','k','MarkerFaceColor','g');
Set the value of a property with set. The first variable in set is the handle of the object whose property is being specified. The remaining entries are in pairs stating the property as a character string and the value, which might be a number or a character string.
LineWidth and MarkerSize are numbers. LineStyle is a character string. Color is a character string (and it can be an RGB triplet which we will talk about at the end of this lesson). Marker is a character string. Visibility is either 'on' or 'off'. The appropriate characters strings for LineStyle, Marker, and Color are given in help plot.
It is possible to get all of the current properties of a graphic object with get(handle) if given an active handle. Or, you can get the value of a particular object with
LW=get(Hp,'LineWidth');The LW will contain the current width of lines on the given plot. To double the width of lines on a plot, consider the following:
  Hp=plot(x,y);
  LW=get(Hp,'LineWidth');
  set(Hp,'LineWidth',2*LW);
The functions set and get work with any object, so we will use them throughout this task.
Flow chart for task:
%%%  define t, and F
%%%  plot the line saving the handle
%%%  add titles and labels
%%%  change the line color and symbols
Solution script for the task:
%%%  define t, and F
t=0:.5:10;F = t.*cos(.1*t);
figure;
%%%  plot the line saving the handle
 Hp=plot(t,F);
%%%  add titles and labels
 Hx=xlabel('Time(hours)');
 Hy=ylabel('Attention Span');
 Ht=title('Mental Alertness');
%%%  change the line color and symbols
 set(Hp,'Color','c','Marker','o','MarkerEdgeColor','b','MarkerFaceColor','b');