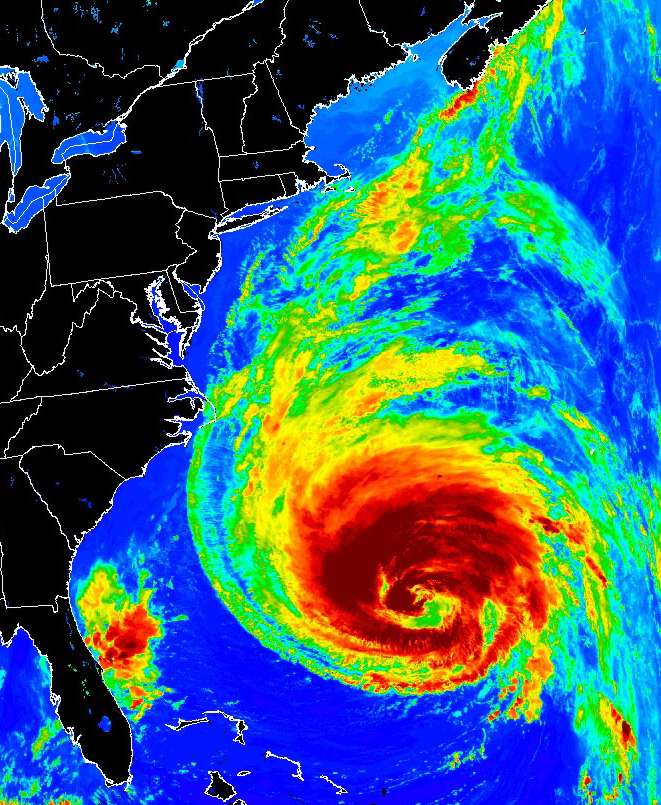
Task: Write a script to read and display the following image files: Hurricane.jpg and Image3.png. Determine what kind of image they are from the character of the image array.
Images displayed on computer screens are basically a large array of little picture elements (pixels) with a given color. With small enough pixels of the right color, a smooth-looking color image appears.
There are two general ways that digital pictures are specified: pixel and vector methods. A pixel image has an array of image elements each of which has the desired color. If the image is enlarged enough, the individual pixels become large squares that are noticable ("a pixelated image"). Vector graphics contain instructions to draw lines of certain colors from one location to another in the image. As an image is expanded, these lines do not get larger so the image retains its detail with expansion. We will not work with vector images in this class.
MATLAB has tools to read and write most of the formats that you are likely to need. With a little understanding of the structure of these images, you can manipulate them in various ways. Note that MATLAB has an image manipulation package (the image processing toolbox) with considerable power. The discussion below will use the relatively simple tools in basic MATLAB.
There are three general types of pixel based images: indexed, intensity, RGB. An indexed file has a 2D array of numbers which are color numbers for each pixel along with a colormap, which translates each color number into a specific color. These images require a color map to be provided along with the pixel array. An intensity based image is typically monochrome (one color such as gray) and the pixel number indicates how bright to make the single color. An RGB, or truecolor, image has three numbers for each pixel which indicate the intensity of red, green and blue lights that create the color of the pixel without additional information.
For all of these types, the image is defined as an array of numbers (or number triplets) for each pixel. For different applications, the number is typically unsigned integers of various lengths (uint8, uint16) or double precision real numbers.
We will discuss integer types in a later part of this class. The basic pattern for integers is intN or uintN where N is the number of bits in the integer (always a power of 2) which can be 8, 16, 32, or 64. The u at the beginning of the integer type indicates that it is an "unsigned" integer. We will see the details of these choices later.
The first task is to read an image from a file and display it. MATLAB will look at the details of the file description and figure out what to do without much interaction from you.
Suppose that you obtain an image file from the web somewhere and saved it with some filename. Then the following will read the image information and display it:
IM=imread(filename)
Him=image(IM);
The first command reads the image description into the variable IM while the second command displays the file. You can put a figure command before the second command to open a graphics window for the image.
You can use size or whos to look at the character of IM to determine some of the details about the image. On the other hand, the following will provide abundant information about the image:
INFO=imfinfo(filename);
The image command will provide a handle for the image object, if you provide an output variable like was done in the example above. Then
get(Him)will also provide information about the image. Some properties of the image can be changed with
set(Him,'PROPERTY','VALUE')
Fundamentally, the image is an array of integers. It might be a 2D or 3D array. You can change the values in these arrays to modify the images, which we talk about in the next section.
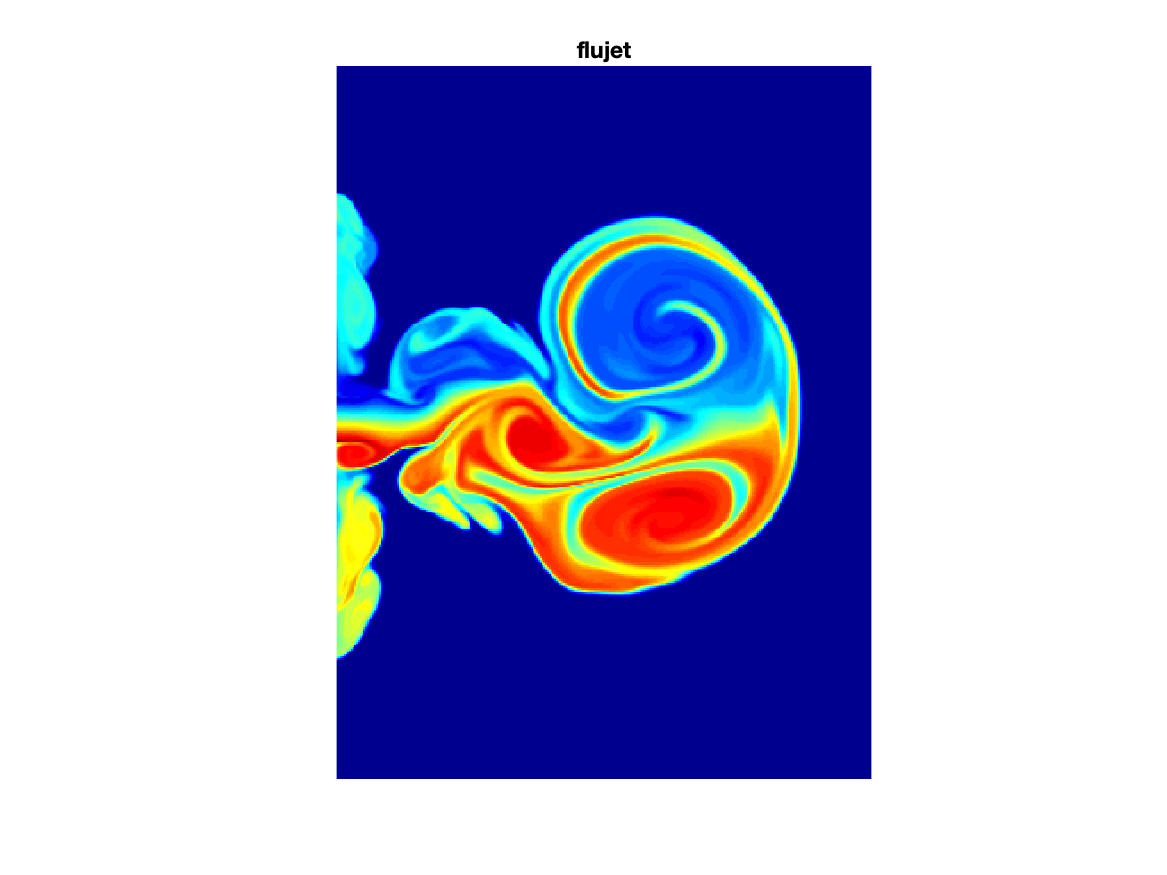
There are several indexed images that are distributed as part of matlab demos (cape.mat, clown.mat, detail.mat, durer.mat, flujet.mat, gatlin.mat, mandrill.mat, spine.mat). These images can be displayed with
load('flujet.mat');image(X);colormap(map);axis image off
Flow chart to accomplish task:
%%%  load hurricane file
%%%  display hurricane image
%%%  get hurricane image info
%%%  load Image3 file
%%%  display Image3
%%%  get Image3 info
Script to accomplish task:
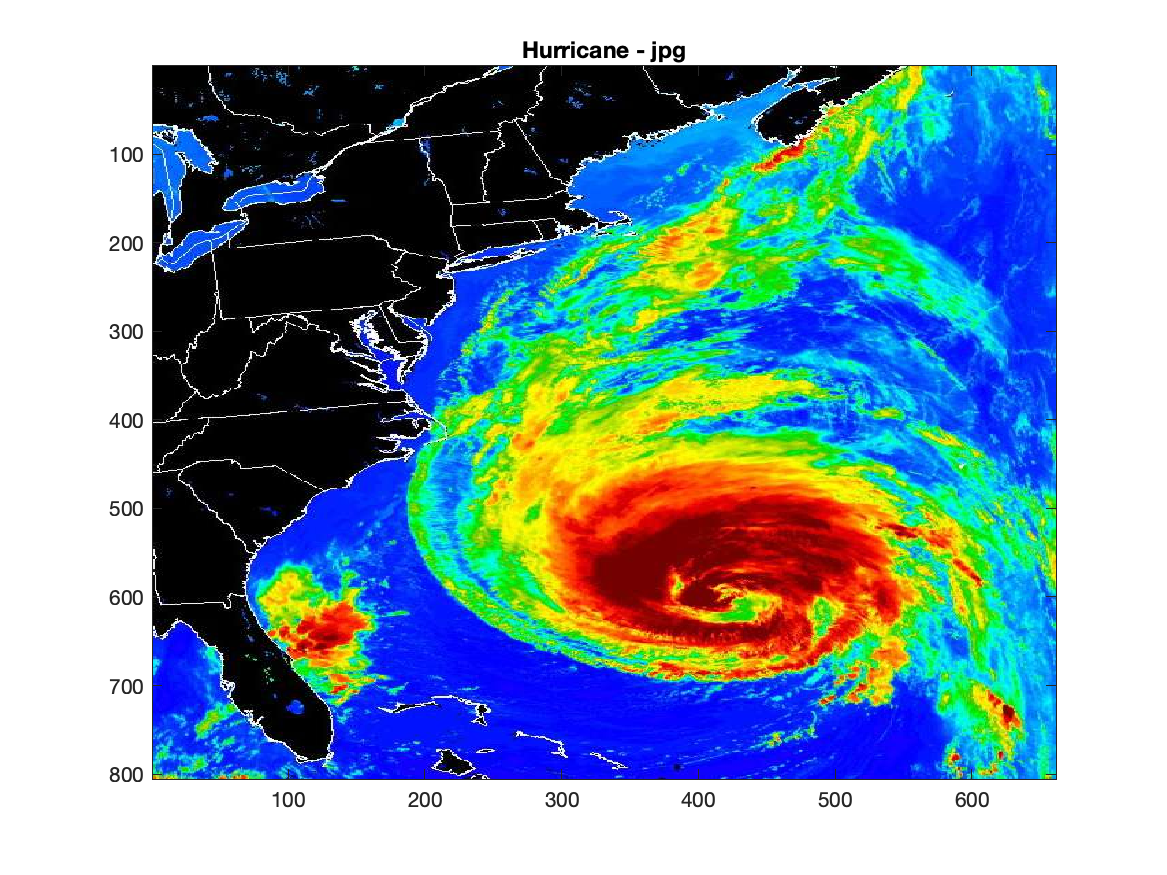
FILE1='Hurricane.jpg';
%%% load hurricane file
im1=imread(FILE1);
% display hurricane image
figure;image(im1);
title('Hurricane - jpg')
%%% get hurricane image info
INFO1=imfinfo(FILE1);
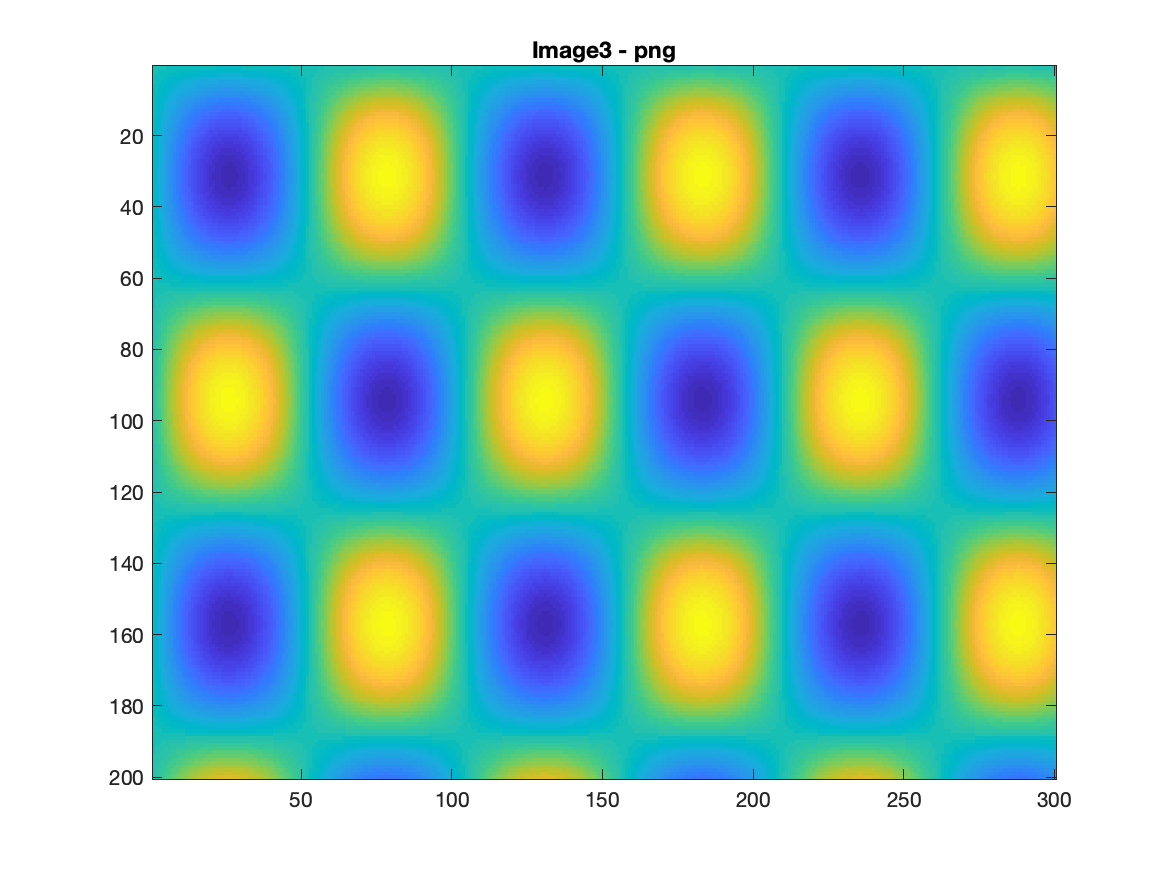
FILE2='Image3.png';
%%% load Image3 file
im2=imread(FILE2);
%%%%% display Image3
figure;image(im2);
title('Hurricane - png')
%%% get Image3 info
INFO2=imfinfo(FILE2);
INFO1=
  struct with fields:
           Filename: '/Users/klinck/Desktop/OEAS406sp20/Data/Hurricane.jpg'
        FileModDate: '02-Jan-2020 09:11:34'
           FileSize: 110045
             Format: 'jpg'
      FormatVersion: ''
              Width: 661
             Height: 805
           BitDepth: 24
          ColorType: 'truecolor'
    FormatSignature: ''
    NumberOfSamples: 3
       CodingMethod: 'Huffman'
      CodingProcess: 'Sequential'
            Comment: {}
        Orientation: 1
        XResolution: 72
        YResolution: 72
     ResolutionUnit: 'Inch'
           Software: 'Adobe Photoshop 7.0'
           DateTime: '2003:09:18 09:40:28'
      DigitalCamera: [1×1 struct]
      ExifThumbnail: [1×1 struct]